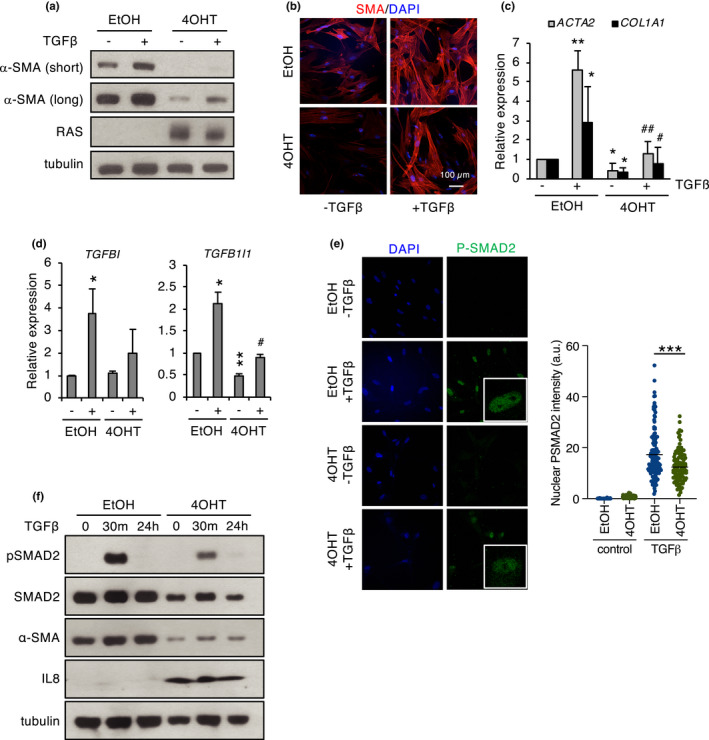
FIGURE 5.

TGF‐β signaling in senescence. (a) Western blot analysis of α‐SMA (short and long exposures) in IMR90 ER:RAS fibroblasts in growing (EtOH) or senescence (4‐OHT) conditions after treatment with TGF‐β (2 ng/ml, 48 h). (b) Immunofluorescence of α‐SMA in the cells described in (a) DAPI was used as a control nuclear stain. (c) qPCR of the indicated myofibroblast markers in the cells described in (a). (d) qPCR of the indicated TGF‐β target genes in the cells described in (a). (e) Immunofluorescence of phospho‐SMAD2/3 in FF292 ER:RAS fibroblasts in growing (EtOH) or senescence (4‐OHT) conditions treated with 10 ng/ml TGF‐β for 30 min. DAPI was used as a control nuclear stain (left). Quantification of nuclear phospho‐SMAD2 intensity (right). The # symbol indicates significance relative to 4‐OHT/control. (f) Western blot analysis of phospho‐SMAD2 in FF292 ER:RAS fibroblasts in growing (EtOH) or senescence (4‐OHT) conditions treated with 10 ng/ml TGF‐β for the indicated times and untreated controls
