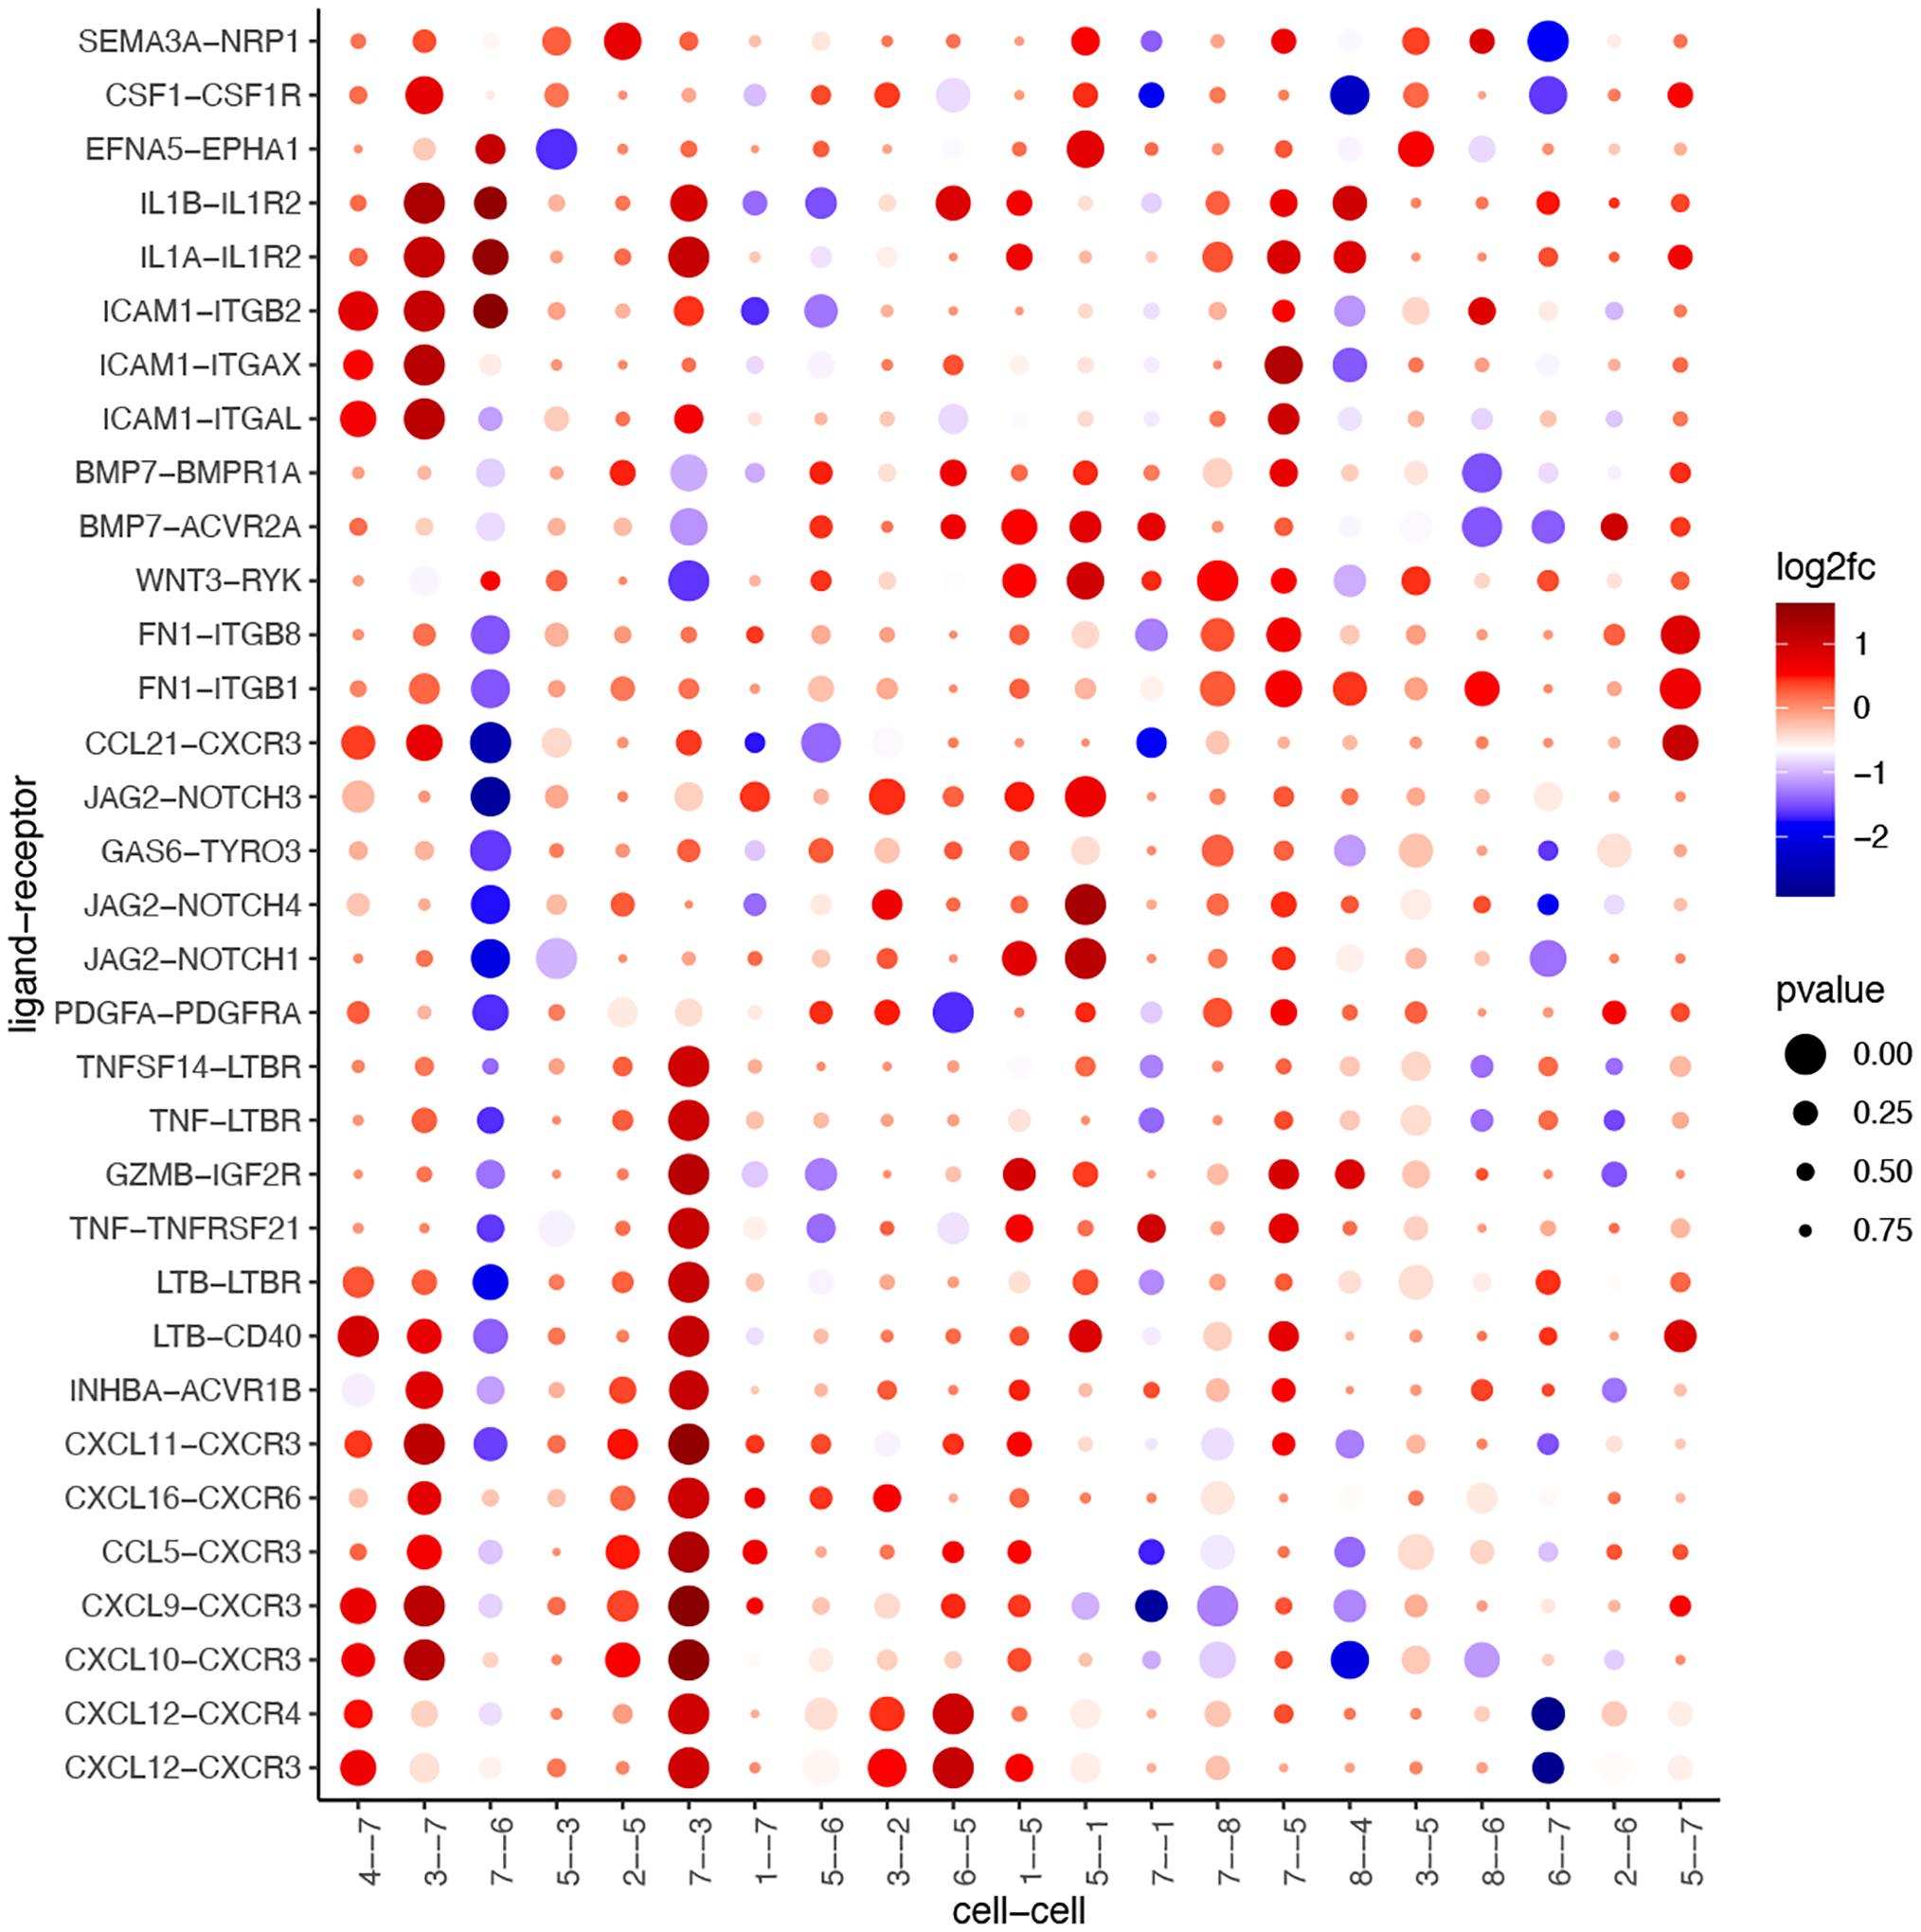
Figure 29:

Ligand-receptor pairs (y-axis) that are detected by Giotto to exhibit differential cell-cell communication scores due to spatial cell-cell interactions (x-axis). The size of the dot is correlated with the adjusted p-value and the color indicates increased (red) or decreased (blue) activity.
