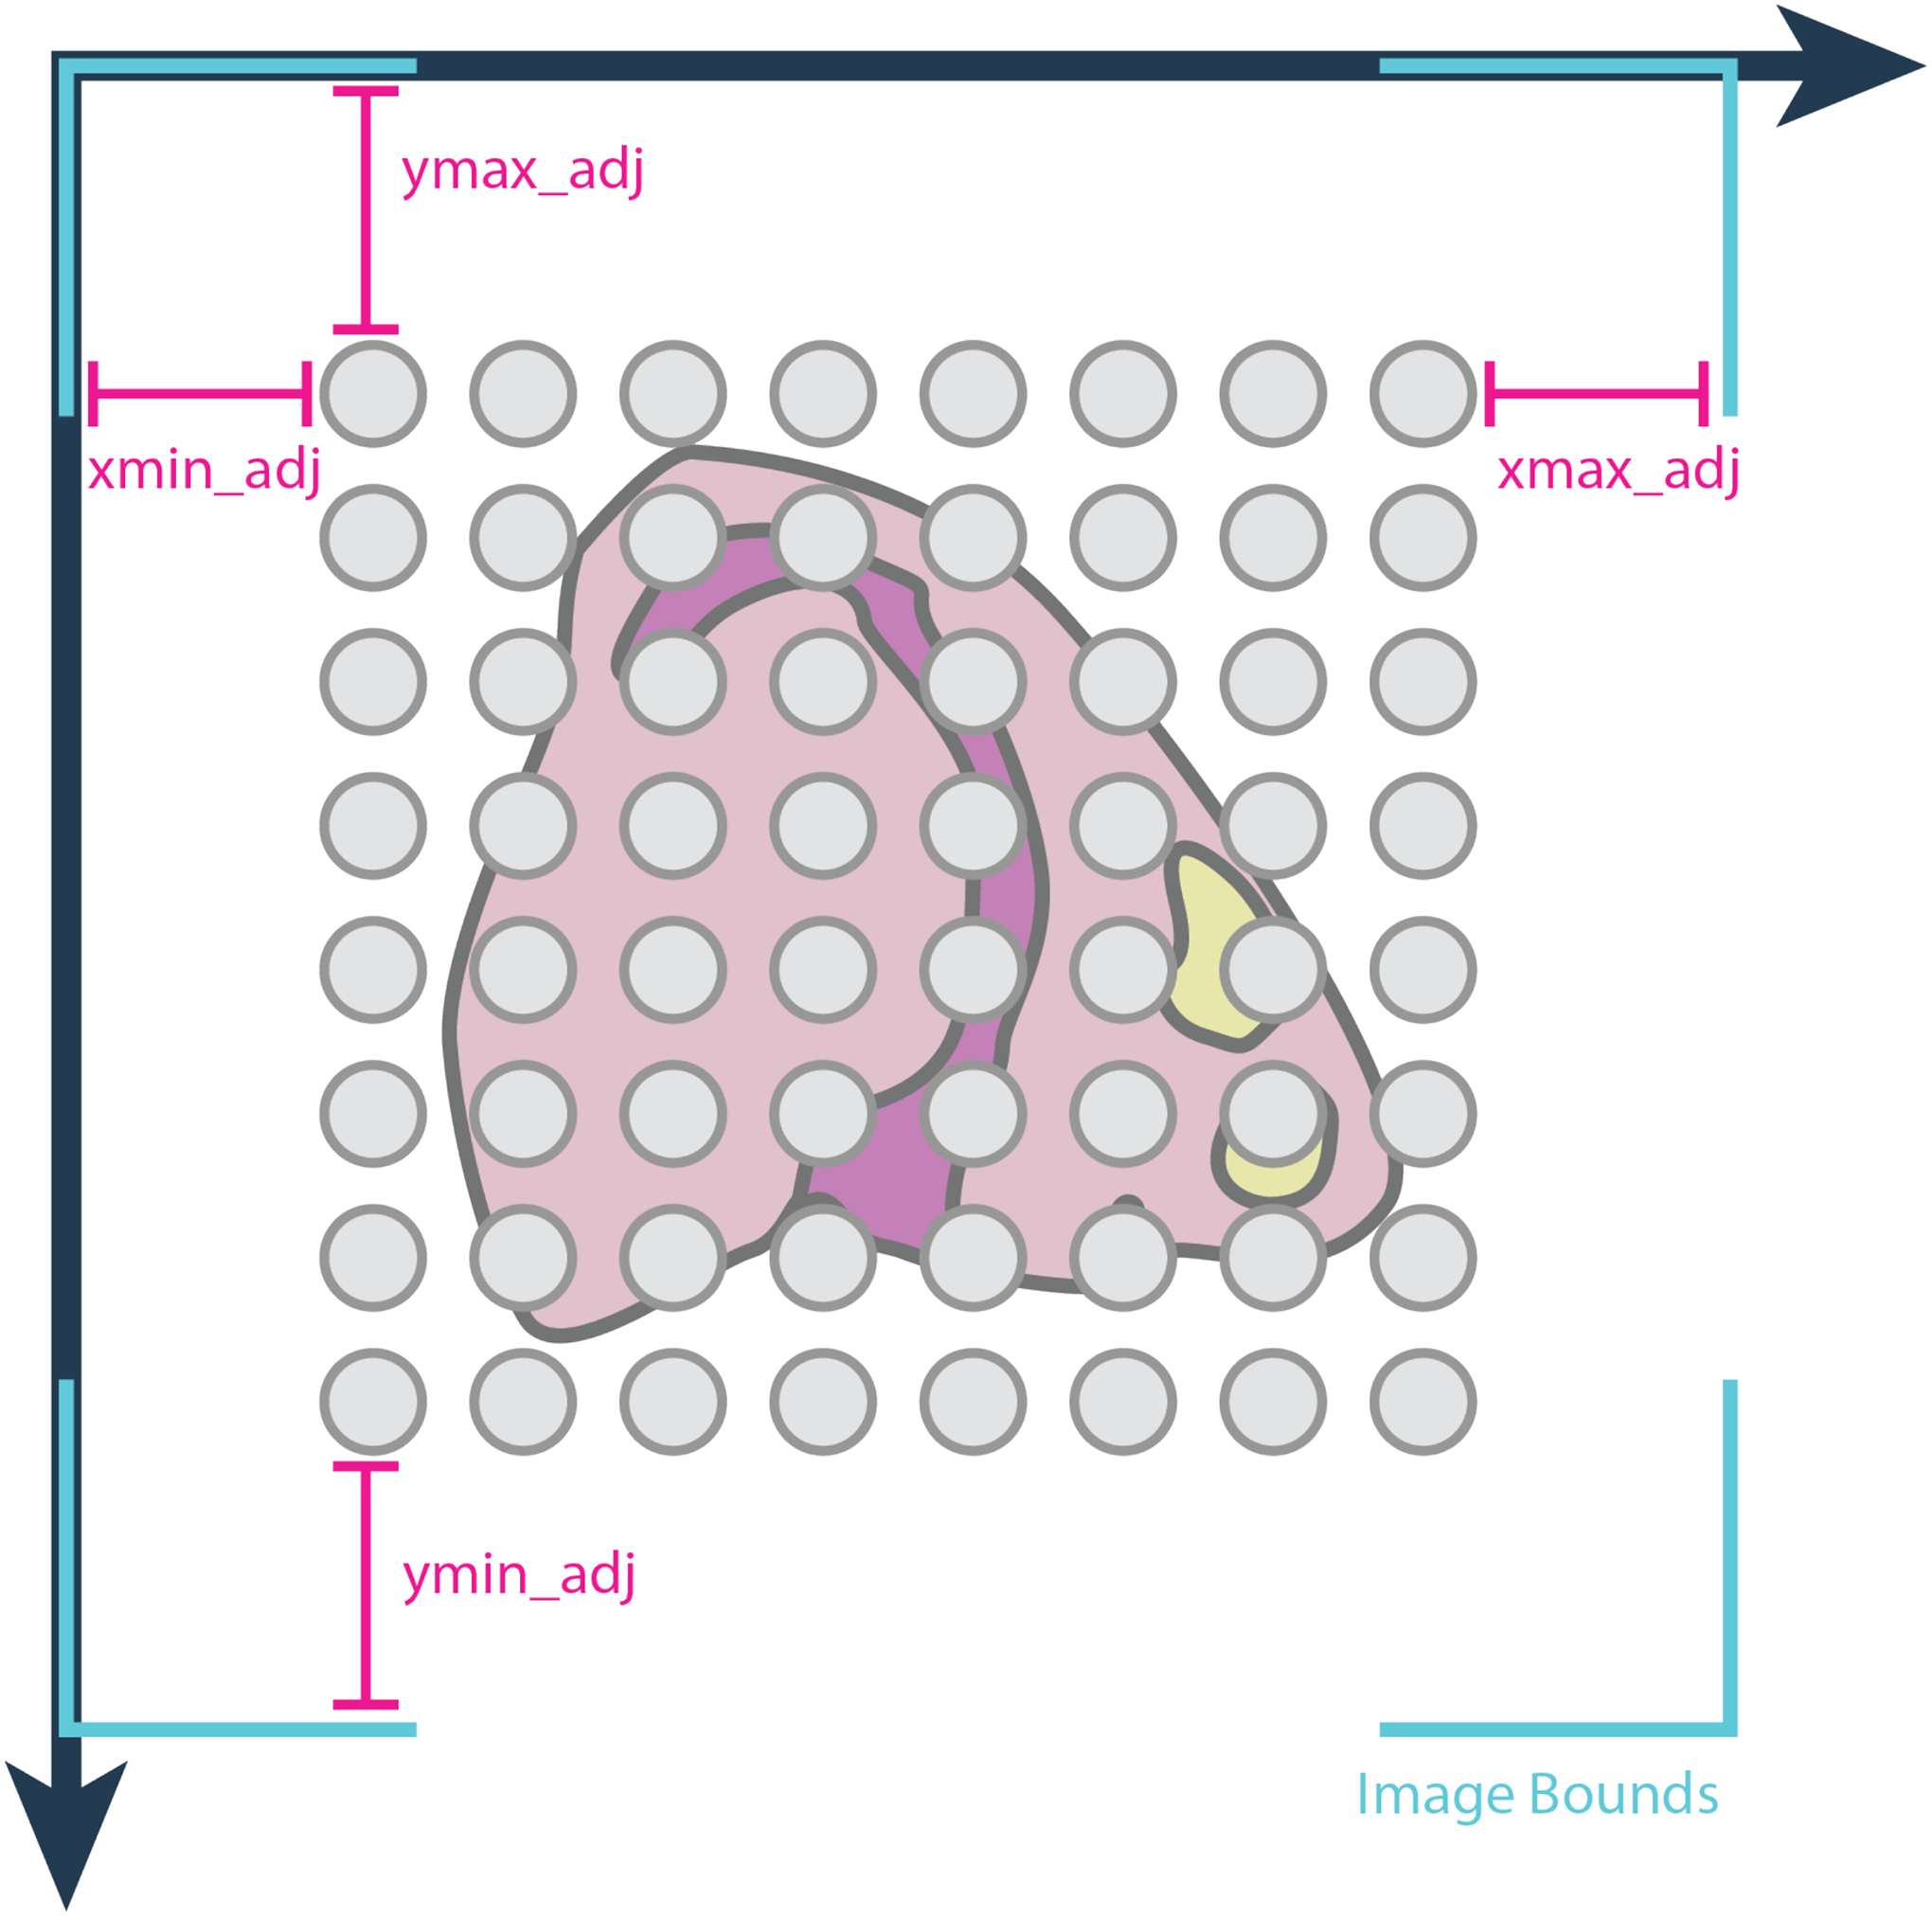
Figure 4:

Spatial location data portrayed as gray spots are overlaid on a staining image of the tissue. By default, the image is stretched to cover as much space as the spatial extents, but if this is inaccurate, adjustment values can be used to adjust where the image bounds (in teal) should be.
