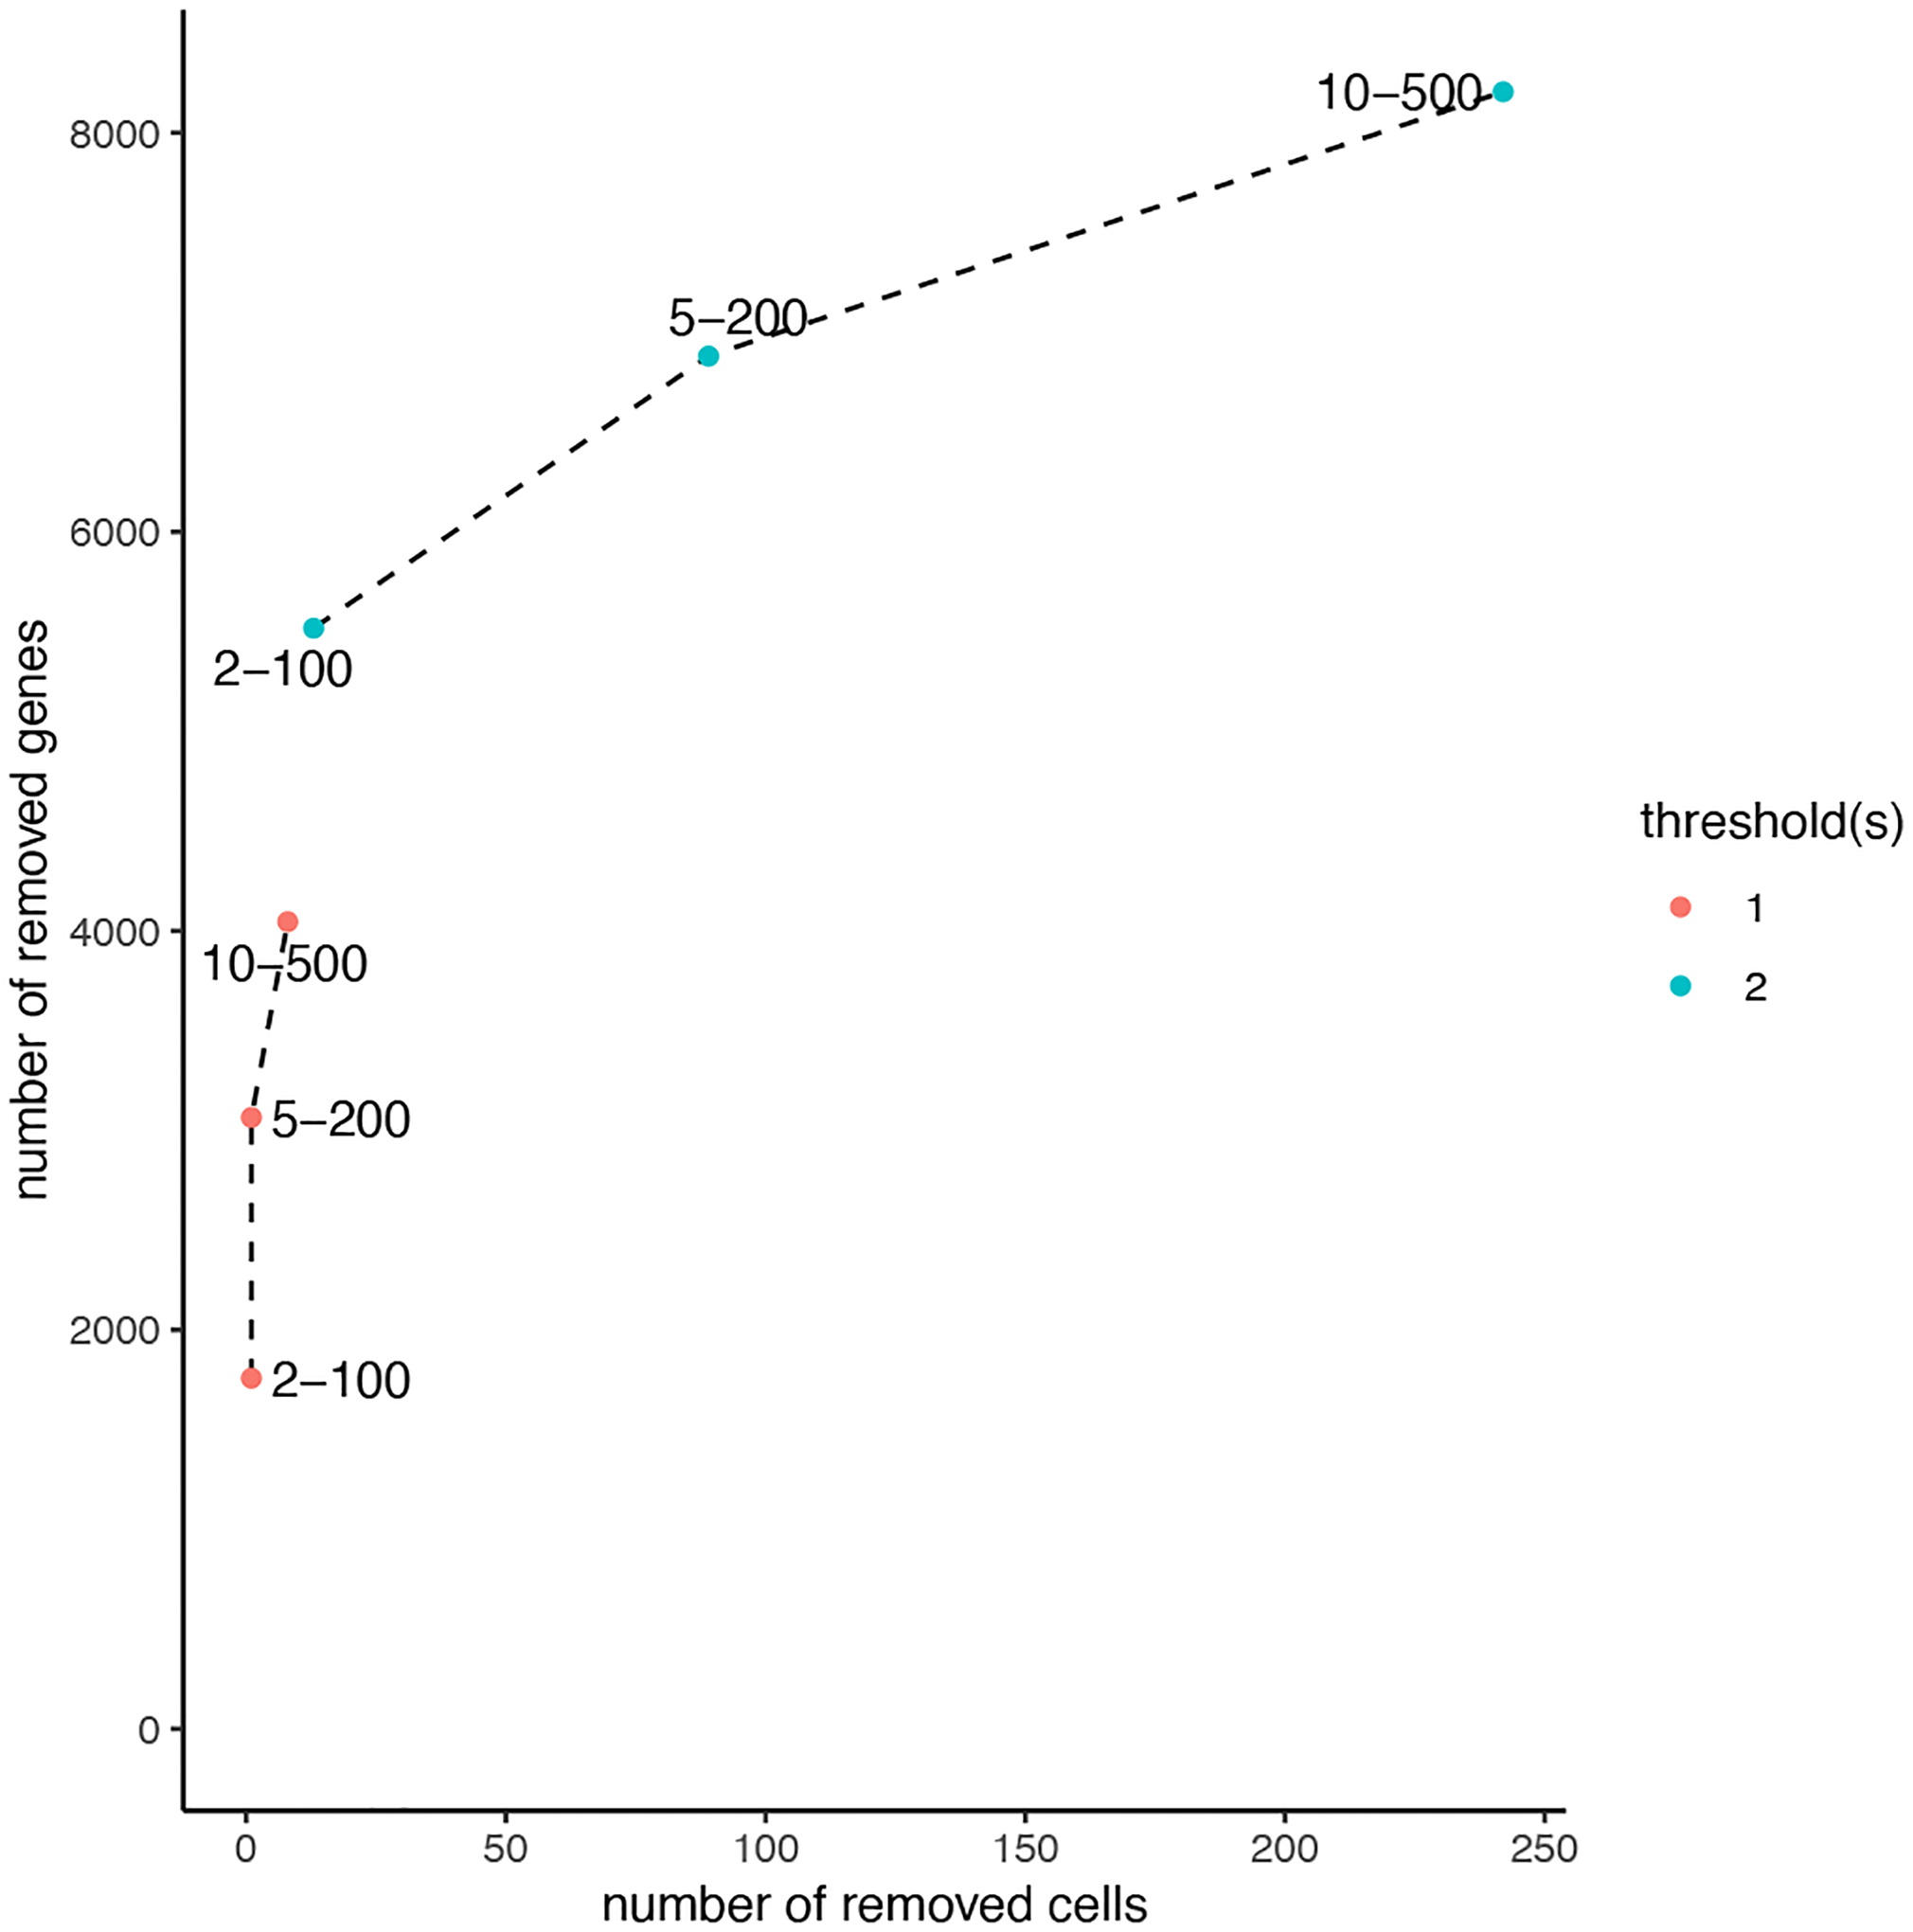
Figure 5:

Effect of different choices of expression filtration combinations. The legend on the right-hand side denotes the minimum expression threshold, while each point on the plot represents the combinations of the minimum number of cells a gene is detected in and the minimum number of genes a cell detects. The x-axis demonstrates the number of cells that would be removed while the y-axis demonstrates the number of genes that would be removed.
