Figure 7:

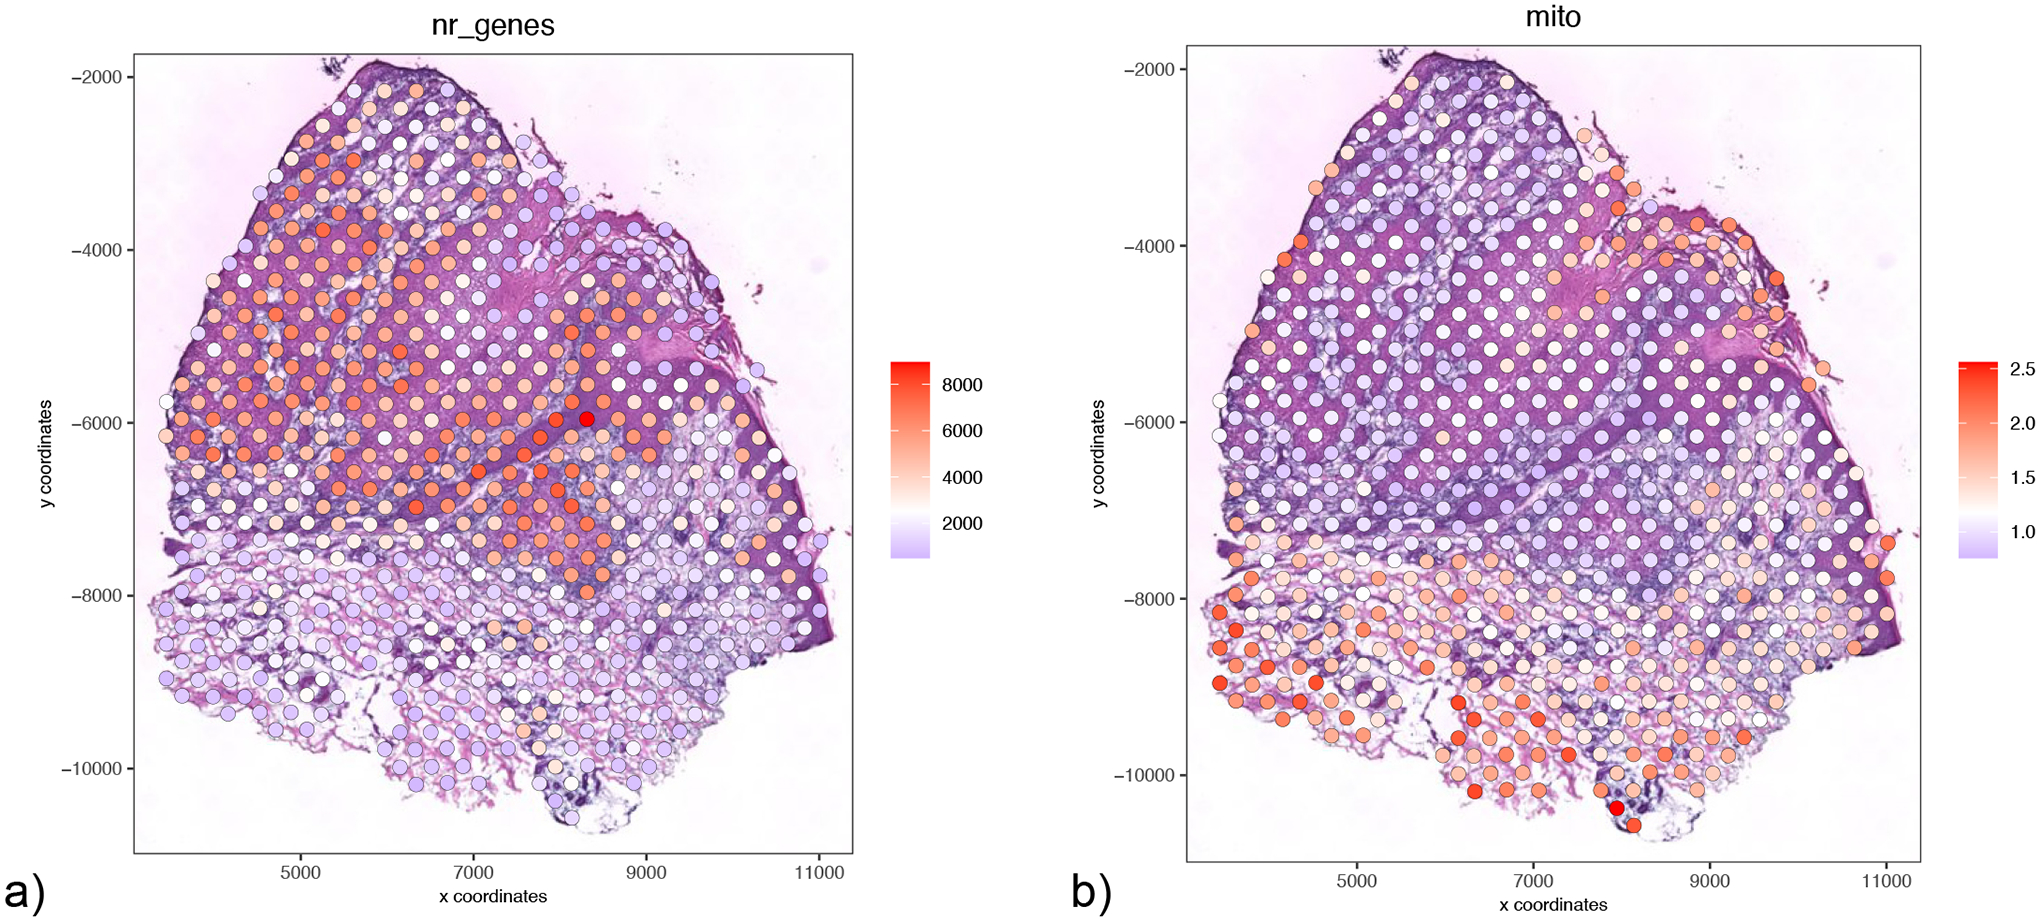
Visualization/exploration of potential technical confounding factors. a) Spatial plot representing number of genes per spot. b) Spatial plot representing mitochondrial percentage per spot.

Visualization/exploration of potential technical confounding factors. a) Spatial plot representing number of genes per spot. b) Spatial plot representing mitochondrial percentage per spot.