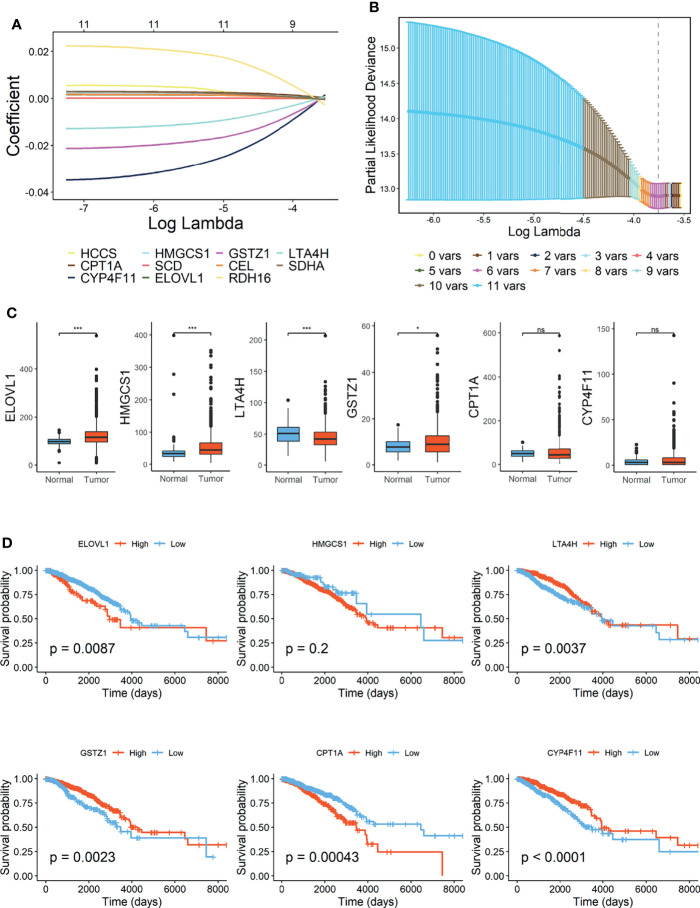
Figure 2.
Construction of fatty acid metabolism-related signature in TCGA-BRCA cohort. (A) Lasso Cox regression analysis. (B) Partial likelihood deviance for the Lasso regression. (C) Expression level of 6 FMGs contained in signature. (D) Kaplan–Meier (K-M) analyses of OS based on expression level of 6 FMGs. TCGA, The Cancer Genome Atlas; FMGs, fatty acid metabolism-related genes; OS, overall survival. *Means p < 0.05; *** means p < 0.001; ns means no significance.

