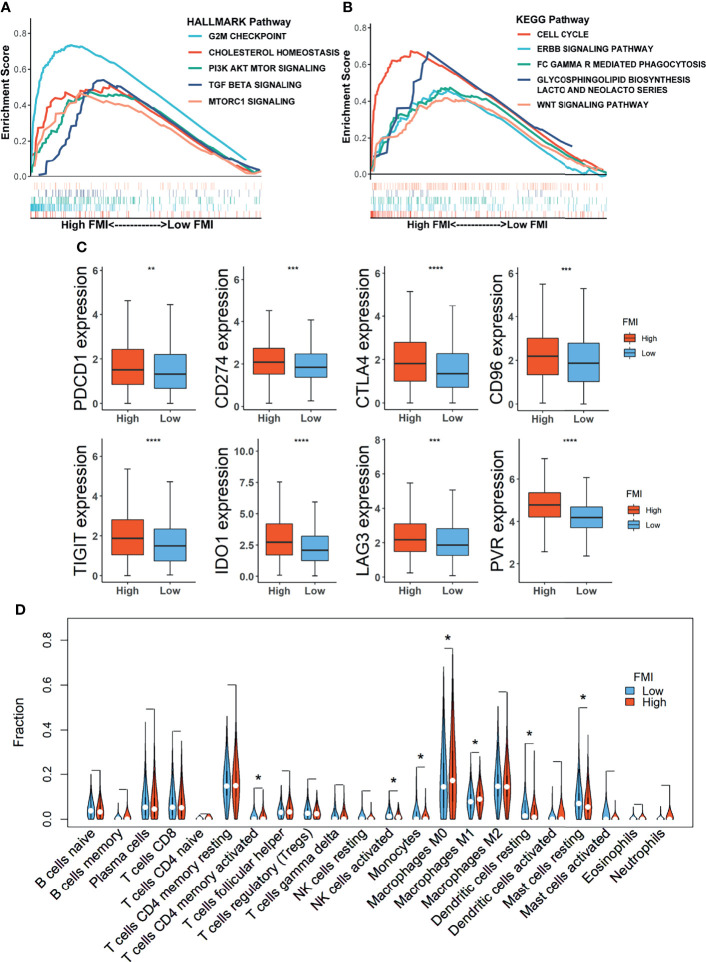
Figure 6.
Gene Set Enrichment Analysis (GSEA) and landscape of tumor immune microenvironment between the high- and low-FMI groups. (A, B) Results of GSEA in TCGA-BRCA cohort. (C) Expression level of immune checkpoints in training set. (D) Violin plots of the proportions of 22 immune-infiltrating cells in total BC patients. FMI, fatty acid metabolism index; TCGA, The Cancer Genome Atlas; BC, breast cancer. *Means p < 0.05; **means p < 0.01; ***means p < 0.001; ****means p < 0.0001.

