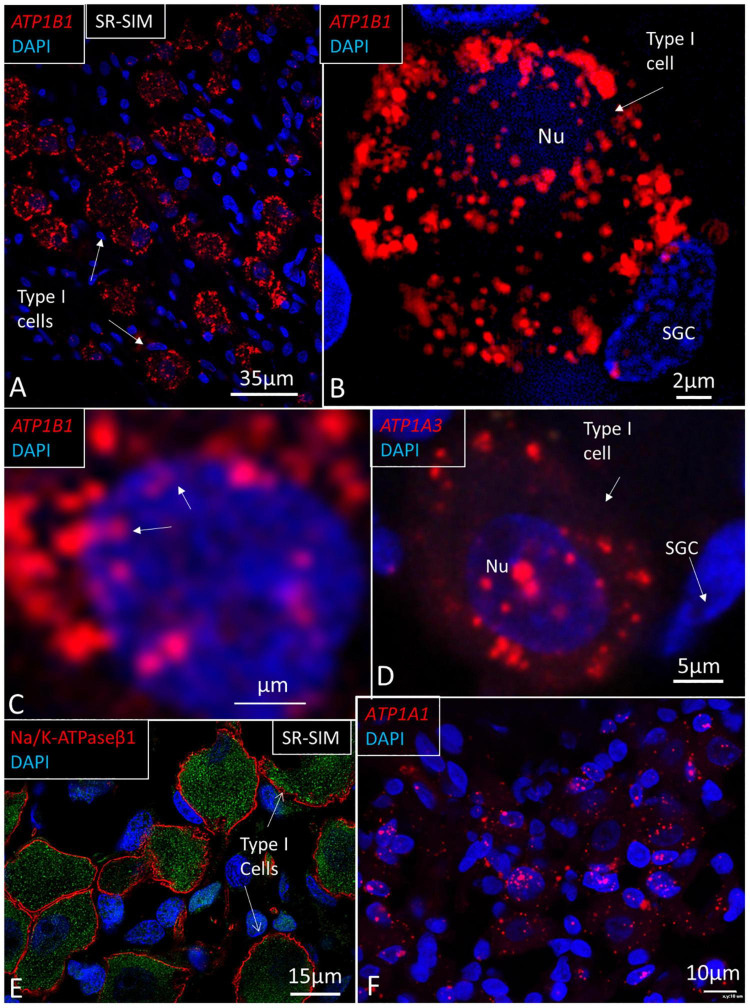
FIGURE 10.
SR-SIM of human spiral ganglion. (A) Type I spiral ganglion cells display a large number of red ATP1B1 gene puncta. (B) Higher magnification of a type I cell shows gene transcripts in the cell nucleus (Nu) and cytoplasm. (C) ATP1B1 gene transcripts are seen at the periphery of the cell nucleus, assumingly at the nuclear pores (arrows). (D) ATP1A3 transcripts in a type I spiral ganglion cell. (E) SR-SIM of type I ganglion cells shows NKAβ1 expression along the plasma lemma. (F) ATP1A1 gene expression in Rosenthal’s canal. Both ganglion cells and adjacent cells show the expression of ATP1A1. SGC, satellite glia cell.

