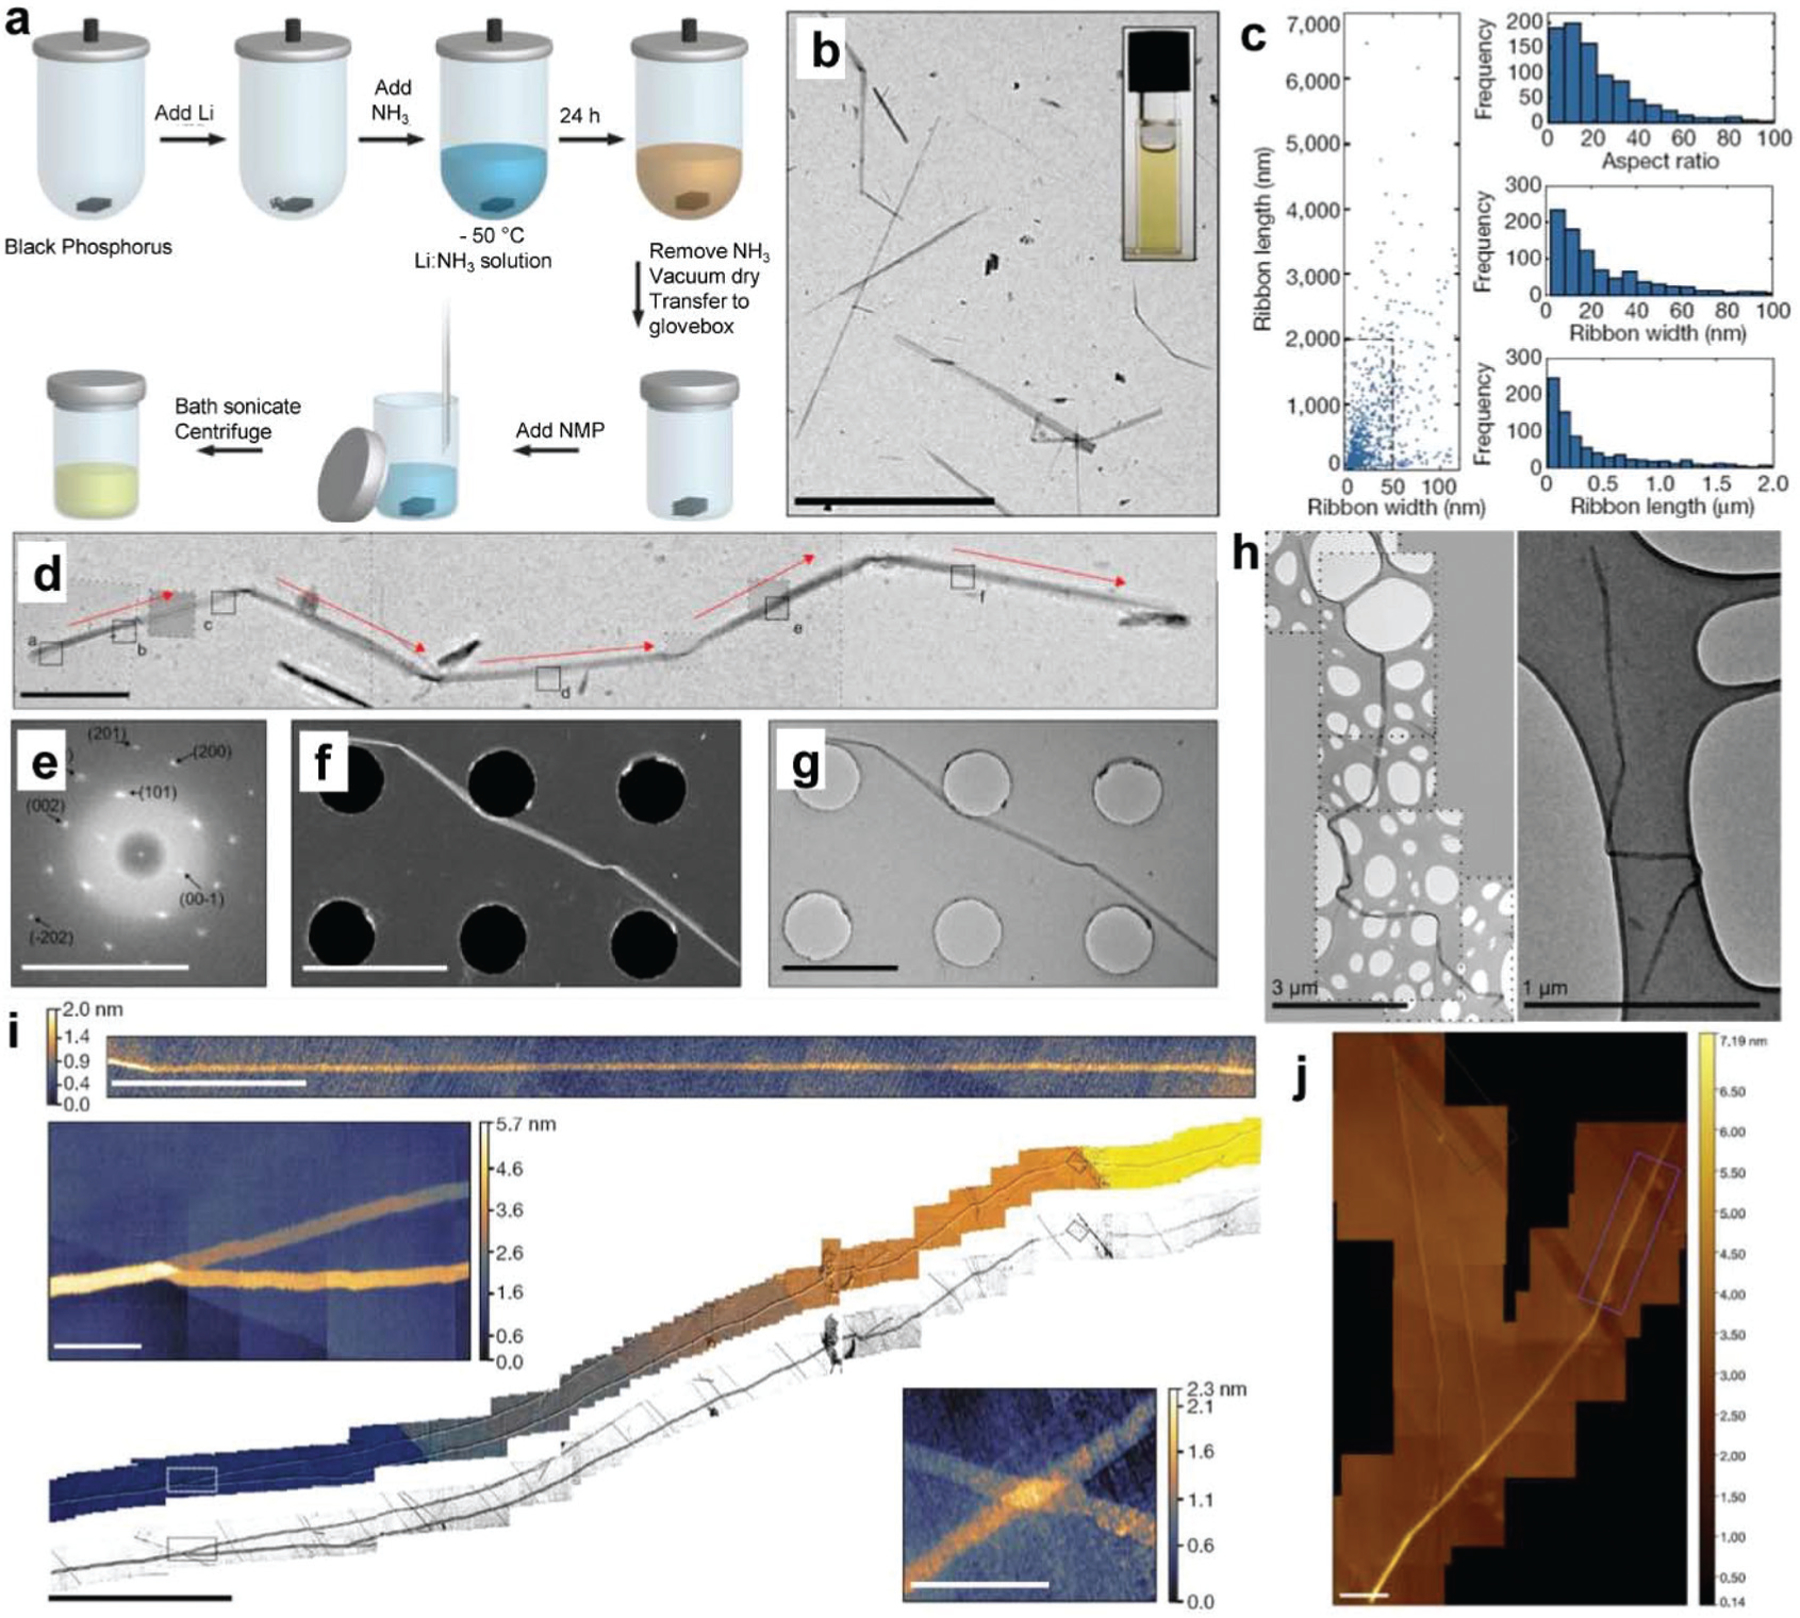
Fig. 4.

Synthesis and characterizations of BP nanoribbons (BPNR). (a) Schematic of fabrication procedures of BPNR. (b) TEM images of fabricated BPNRs. Scale bar, 10 µm. (c) Scatterplot of BPNR length and width for 940 BPNRs as measured by TEM and histograms showing aspect ratios, widths, and lengths for the fabricated BPNRs. (d) TEM images of a roughly 11 μm BPNR that has folded upon drying. Red arrows indicate the zigzag crystallographic direction. (e) Indexed FFT transform of the HRTEM images. Scale bar, 10 nm. (f) The STEM (scale bar, 2.5 µm) and (g) TEM (scale bar, 2 µm) images of the fabricated BPNR. (h) TEM images of BPNRs showing flexibility. (i) HS-AFM micrograph of a monolayer BPNR (scale bar, 500 nm) and large-area composite HS-AFM image of a BPNR longer than 75 µm (center image, scale bar, 10 µm) with magnified sections corresponding to the dashed boxes on the central image (top left and bottom right image, scale bars, 500 nm). (j) HS-AFM images (scale bars, 200 nm) of areas over which the stability study of BPNR was undertaken. Reproduced with permission.71 Copyright 2019, Nature Publishing Group.
