
Figure 3: Cross-population PRS results for simulated UK Biobank traits using in-sample LD.
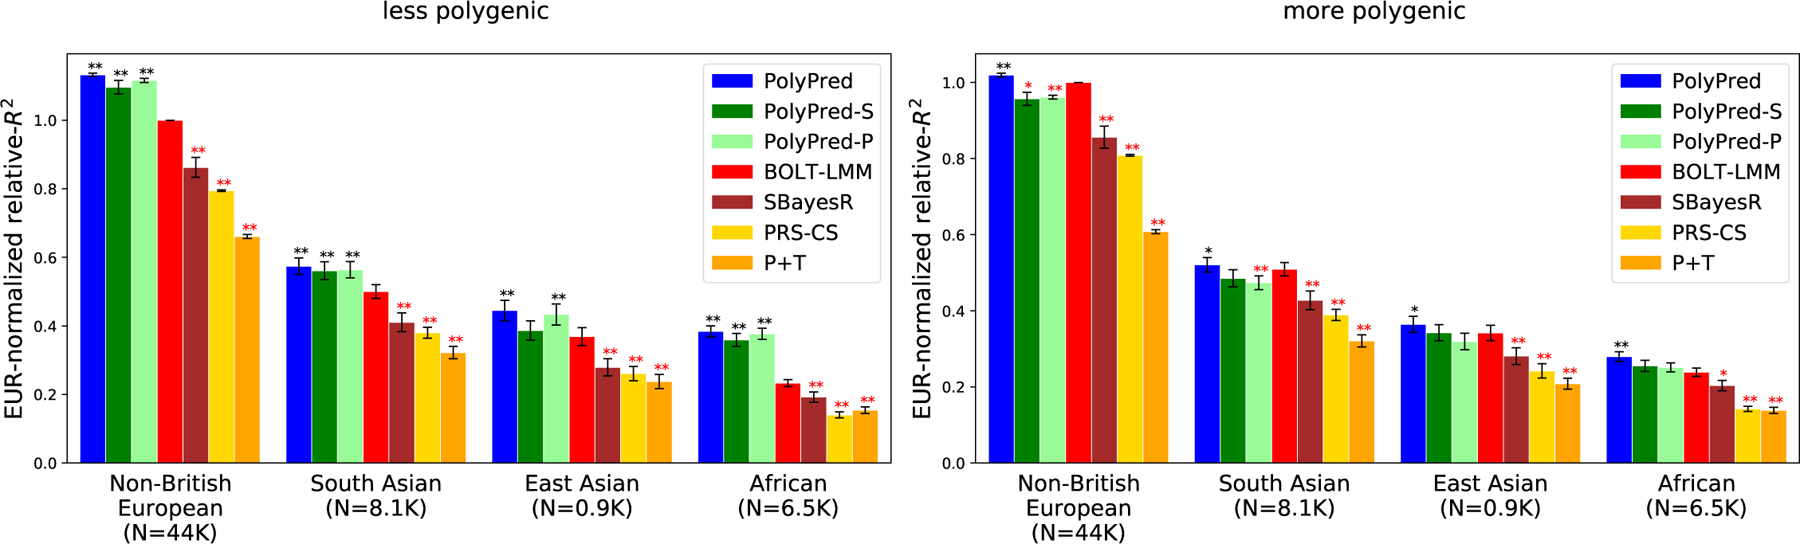
We report average prediction accuracy (relative-R2; see main text) for PRS trained in UK Biobank British samples (N=337K) and applied to 4 UK Biobank target populations across 100 simulated traits with less polygenic (0.1% of SNPs causal; left panel) or more polygenic (0.3% of SNPs causal; right panel) architectures. Target population sample sizes are indicated in parentheses; PolyPred and its summary statistic-based analogues used 500 additional training samples from each target population to estimate mixing weights. Asterisks above each bar denote statistical significance of the difference vs. BOLT-LMM, with black asterisks denoting an advantage and red asterisks denoting a disadvantage (*P<0.05; **P<0.001). P-values were computed using a two-sided Wald test and were not adjusted for multiple comparisons. Errors bars denote standard errors. Numerical results, absolute prediction accuracies (R2), and P-values of relative improvements vs. BOLT-LMM are reported in Supplementary Table 1.