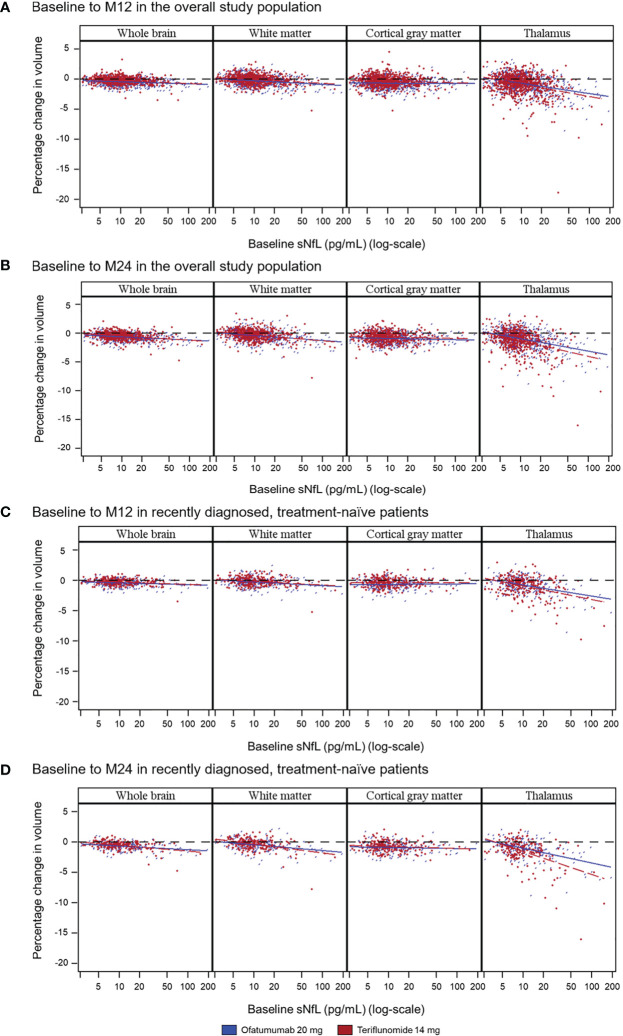
Figure 3.
Correlation between baseline sNfL concentrations and on-study whole and regional brain volume change as illustrated in scatter plots over the specified time period in either the overall population (A: baseline to M12; B: baseline to M24), or in the subgroup of recently diagnosed, treatment-naive patients (C: baseline to M12; D: baseline to M24). Random coefficients model adjusted for study, treatment, region, and baseline sNfL category as fixed effects factors; time, baseline number of Gd+ T1 lesions, baseline T2 volume, and normalized brain volume (whole or regional) at baseline as continuous covariates; and treatment-by-time-by-baseline sNfL category interaction and the three corresponding two-way interactions. Gd+, gadolinium-enhancing; M, month; NfL, neurofilament light chain.

