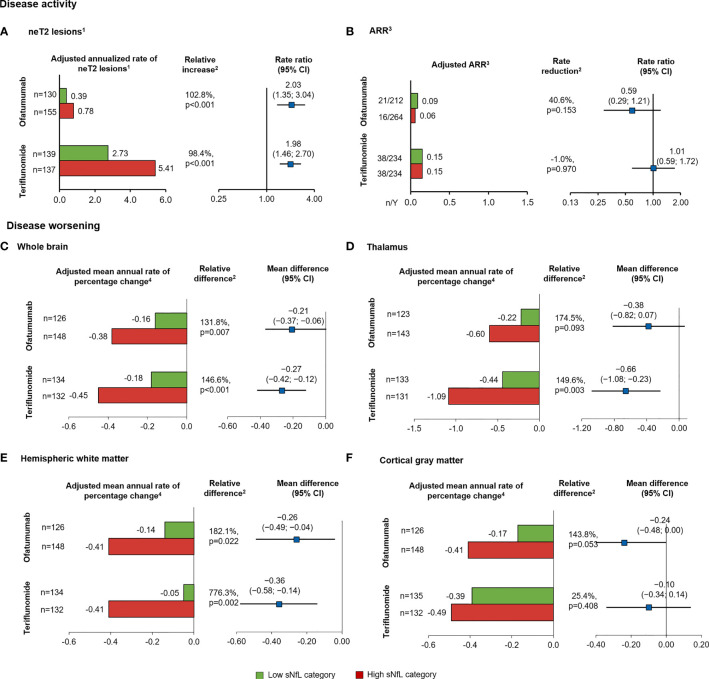
Figure 4.
Prognostic value of baseline sNfL category [high (red), ≥9.3 pg/ml; low (green), <9.3 pg/ml) on measures of MS disease activity and worsening, in the subgroup of recently diagnosed, treatment-naive patients. (A) neT2 lesions per year, (B) annualized relapse rate. Annual rate of brain volume change in the (C) whole brain, (D) thalamic volume, (E) hemispheric WM, (F) cortical gray matter. Comparisons are between high vs. low sNfL categories. 1The number of neT2 lesions (compared to baseline or month 12) was analyzed in a negative binomial model with adjustments for treatment, baseline sNfL category, region and study as factors, and age, baseline volume of T2 lesions as continuous covariates, and treatment by baseline sNfL category interaction. The natural log of the time from the baseline scan (in years) was used as the offset. 2Indicates statistical significance (two-sided) at the 0.05 level. 3Negative binomial regression model with log-link to the number of relapses adjusted for treatment, baseline sNfL category, region and study as factors, number of relapses in previous year, baseline EDSS, baseline number of Gd+T1 lesions, and the patient’s age at baseline as covariates and treatment by baseline sNfL category interaction. The natural log of the time in study was used as offset to annualize the relapse rate. 4Annual rate of brain volume change obtained from a random coefficients model with study, treatment as fixed effects (factors), and time as continuous covariates and treatment by time interaction for the overall analysis, with additional co-factors of subgroup, treatment by subgroup, and treatment by time by subgroup interactions for the subgroup analysis. Random terms for slopes and intercept are included. ARR, annualized relapse rate; BVL, brain volume loss; CI, confidence interval; cGM, cortical gray matter; EDSS, Expanded Disability Status Scale score; Gd+, gadolinium-enhancing; neT2, new or enlarging T2 lesions; LS, least square; sNfL, serum neurofilament light; WM, white matter.

