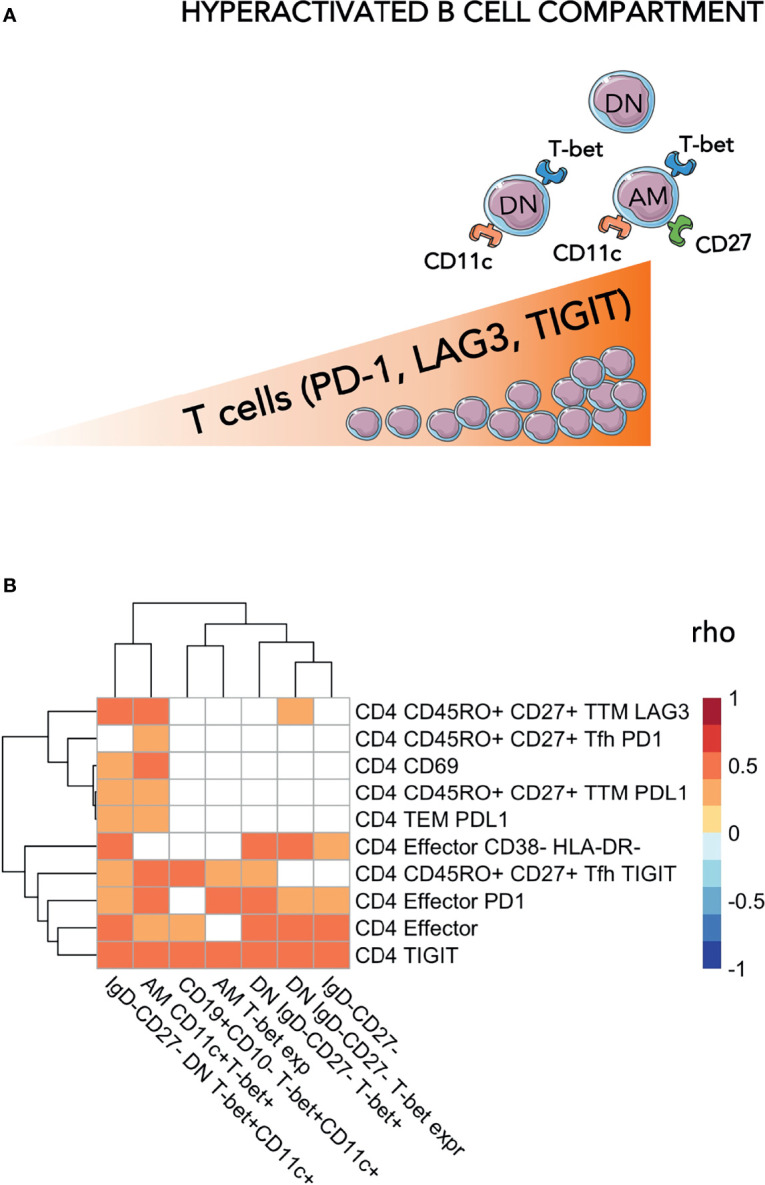
Figure 2.

Levels of exhausted T-cells are positively associated with hyperactivated B-cells. In (A) a cartoon showing the main findings of the figures are pictured. In (B) Heatmap plot showing Spearman correlations between exhausted T-cells and hyperactivated B-cells. Only significant correlations are shown with red indicating positive correlations and Blue the negative ones. The colored scale going between 1 and -1 indicates the rho values. DN, double negative; AM, activated memory. Significance was set at p<0.05.
