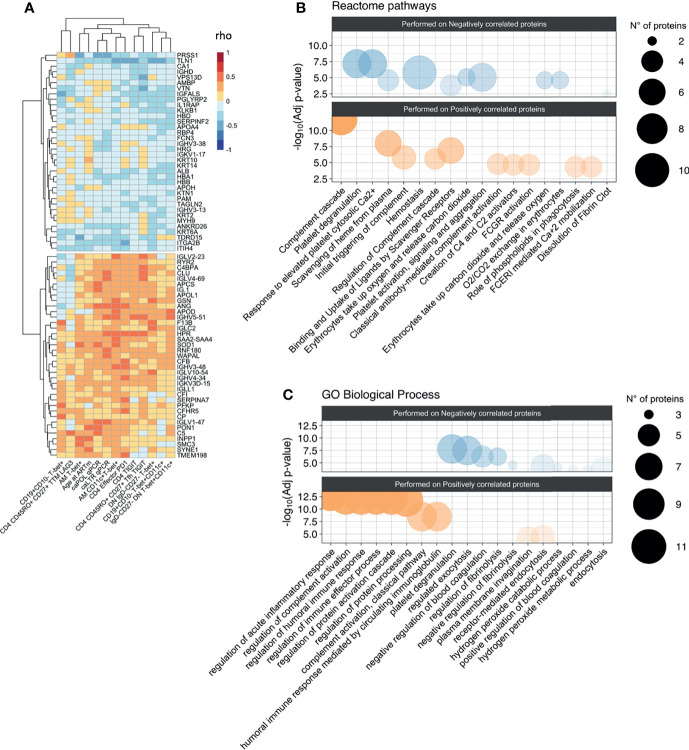
Figure 3.
Association between proteomic profiling and levels of hyperactivated B-cells and exhausted T-cells. (A) Heatmap plot showing Spearman correlations between the 13 unfunctional features values and the abondance of the 73 plasma proteins belong to the two clusters identified in correlation matrix with all 338 proteins. Red indicates positive correlations and Blue negative ones. Bubble plots showing the top 10 Reactome pathways (B) and GO Biological Process (C) significantly enriched (Adjusted p-value < 0.05) in proteins positively (Pos) and negatively (Neg) correlated with the 13 unfunctional features. The proteins were separated into positively and negatively correlated based on the two clusters showed in the correlation heatmap in panel (A) Colors are related at the log10 adjusted p-value values and the circle diameter are related at the number of proteins for each term. Significance was set at p<0.05.

