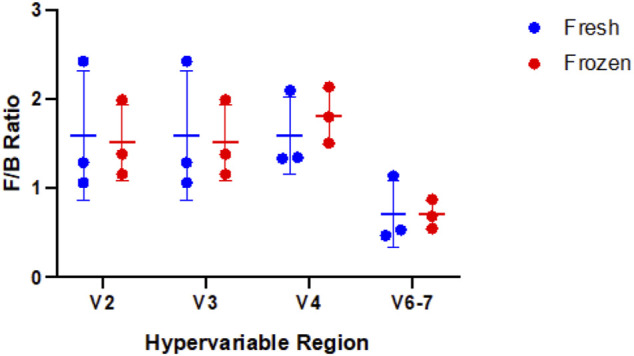
FIGURE 10.

Comparison of Firmicutes to Bacteroidetes (F/B) ratio in fresh versus frozen samples by hypervariable region. No significant difference was observed between fresh and frozen samples for the hypervariable regions (V2 p-value = 0.87, V3 p-value = 0.87, V4 p-value = 0.51, V6-7 p-value = 0.97).
