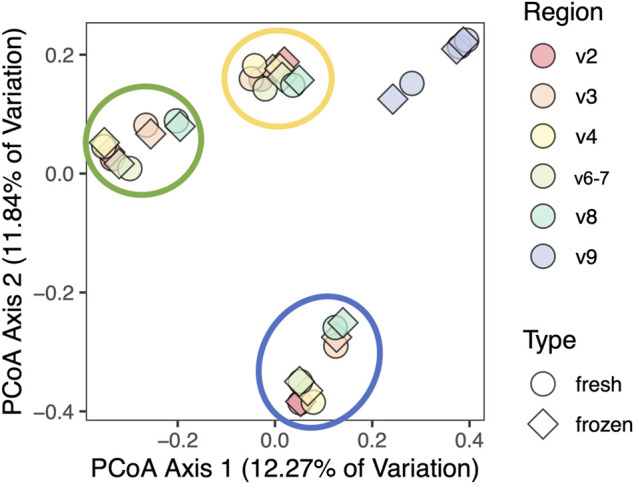
FIGURE 7.

Principal coordinates analysis of clinical cohort using Canberra distance matrix. Samples and regions from the same person are circled, excluding V9. Results cluster by individual and by V9 region (not circled), but not by fresh versus frozen status.
