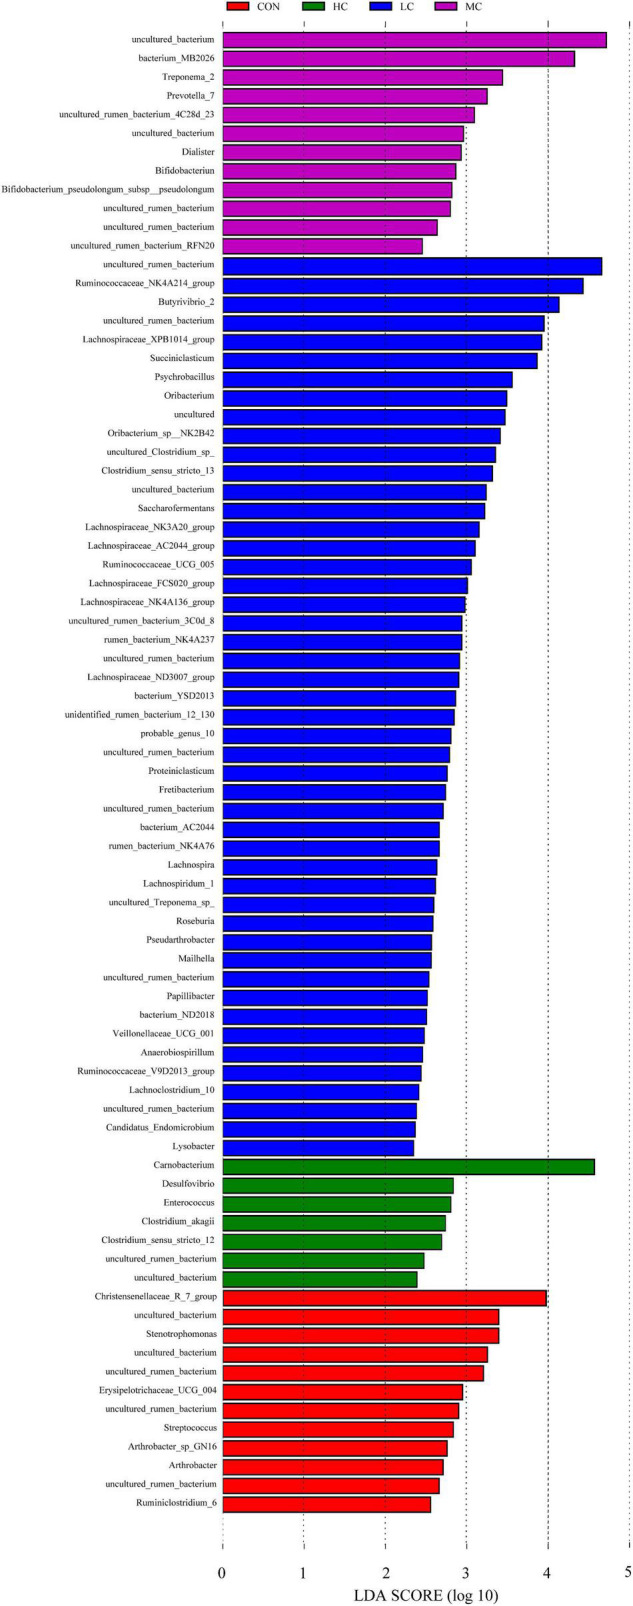
FIGURE 4.

Histogram of LDA score calculated for each taxon ranging from phylum to genus. The LDA scores represent the difference in relative abundance with an exponential fold change of 10 between both communities, indicated by the significant difference in taxa. Red: Taxa abundant in CON, Green: Taxa abundant in HC, Purple: Taxa abundant in MC, Blue: Taxa abundant in LC. CON, C. deserticola at 0%; LC, C. deserticola at 2%; MC, C. deserticola at 4%; HC, C. deserticola at 6%.
