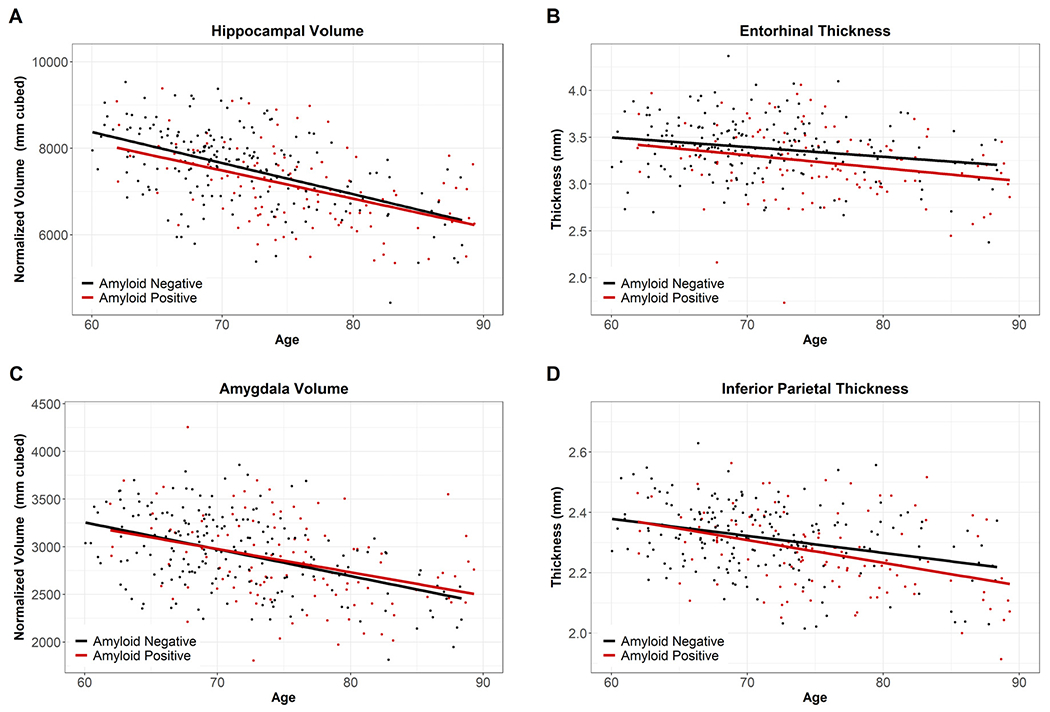
Fig. 4.

Example Regions for Normal Aging Cohort vs. Preclinical AD Cohort. Fig. 4 displays the overlap of the Normal Aging Cohort (Amyloid Negative, black) and the Preclinical Cohort (Amyloid Positive, red), indicating our non-significant findings for amyloid and age* amyloid. (For interpretation of the references to color in this figure legend, the reader is referred to the Web version of this article.)
