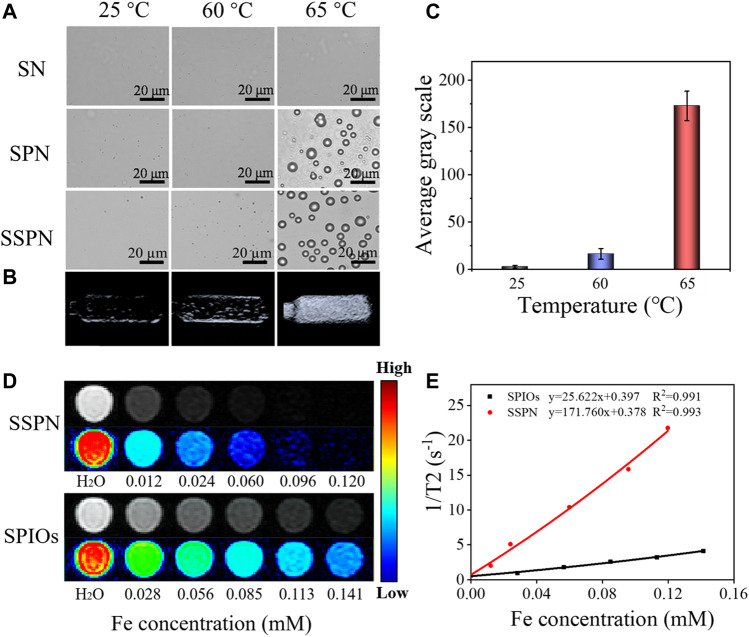
FIGURE 3.
(A) Polarizing microscope images of SNs, SPNs, and SSPNs before and after being heated from 25°C to 65°C (scale bar = 20 μm). (B) In vitro US images of SSPNs at 25°C, 60°C, and 65°C and (C) average gray values of SSPNs (n = 3). (D) T2-weighted MR images of SSPNs and SPIOs at different Fe concentrations using a 1.5-T MRI scanner. (E) T2 relaxation rates of SSPNs and SPIOs corresponding to (D).

