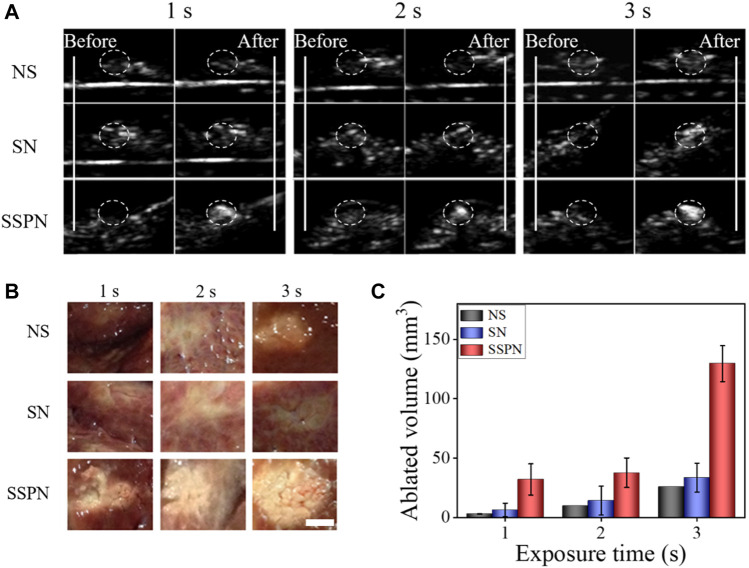
FIGURE 4.
(A) B-mode ultrasound images of NS, SN, and SSPN before and after HIFU irradiation on pig livers at 270 W for 1, 2, and 3 s. (B) Digital photos of ablated degassed pig livers at 270 W cm−2 for 1, 2, and 3 s (scale bar = 5 mm). (C) The corresponding necrotic volumes after HIFU irradiation (n = 3).

