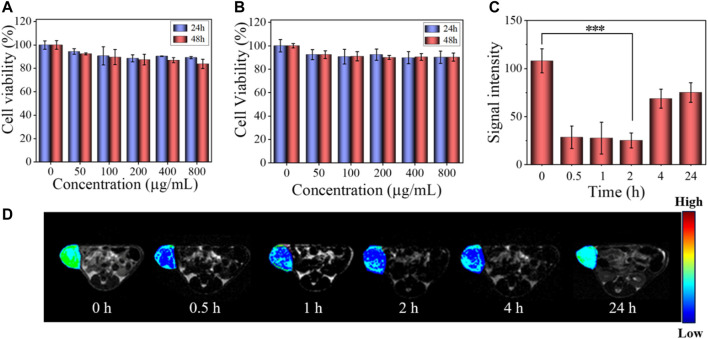
FIGURE 5.
(A) Viability of HeLa cells after incubating with SPNs for 24 and 48 h. The data are given as mean ± SD (n = 5). (B) Viability of HeLa cells after incubating with SSPNs for 24 and 48 h (n = 5). (C) Signal intensity of in vivo MR imaging corresponding to (D) (n = 3,***p < 0.001, **p < 0.01, *p < 0.05). (D) In vivo MR images of tumor after intravenous injection of SSPNs (100 μl, 10 mg ml−1) at different times.

