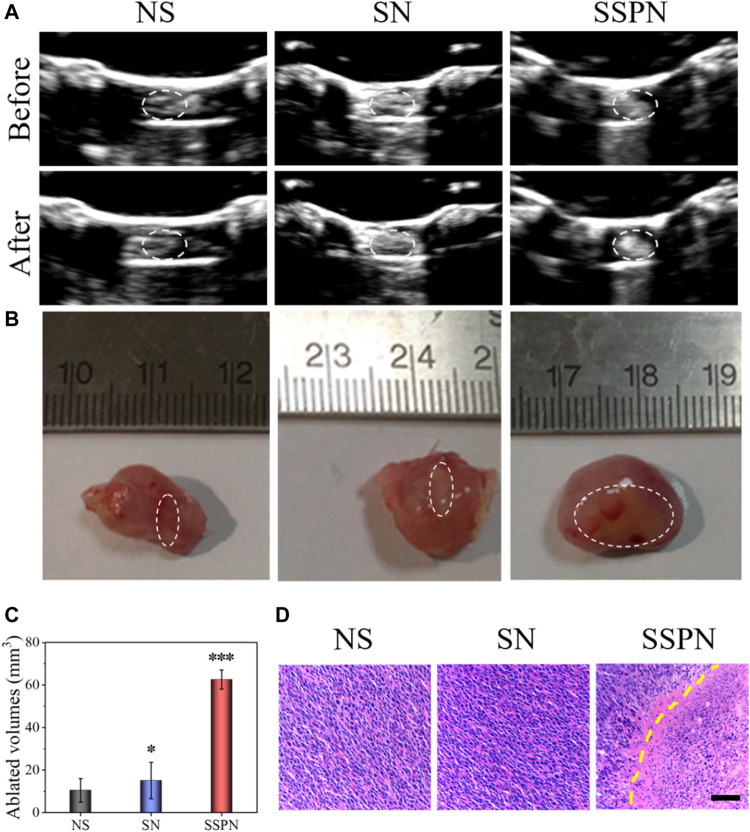
FIGURE 6.
(A) B-mode ultrasound images of NS, SNs, and SSPNs before and after HIFU irradiation. (B) Digital photos of ablated tumors. (C) Quantification of the corresponding necrotic volume after HIFU irradiation (n = 3,***p < 0.001, **p < 0.01, *p < 0.05). (D) H&E staining of tumor sections after HIFU ablation; images were acquired at 200× magnification (scale bar = 50 µm).

