
FIGURE 11.
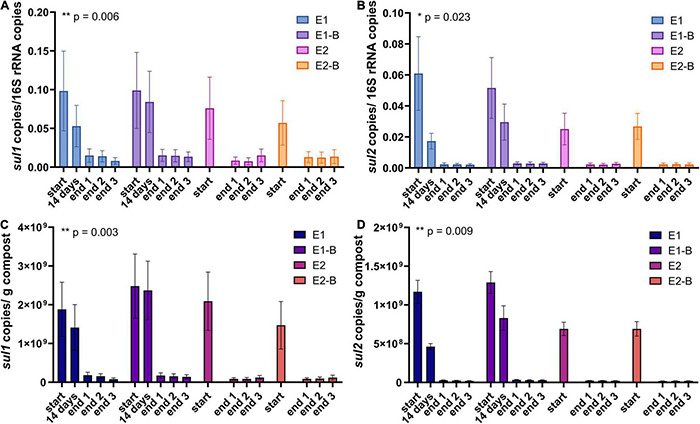
Copy numbers of sulfonamide ARGs sul1 (A,C) and sul2 (B,D) as assessed by qPCR. Copy numbers were normalized to 16S rRNA gene copy numbers (upper charts) and to 1 g compost (lower charts). Bars represent the average of three individual qPCR measurements with the standard deviation. Start, 14 days (only repetition 1) and end samples are depicted individually for the first (E1, E1-B) and second repetition of composting (E2, E2-B). End samples comprise replicates from front (end 1), middle (end 2) and back (end 3) of each compost pile. Asterisks indicate the p-values obtained from Student’s t-test (**p < 0.01, *p < 0.05) representing the statistical significance of the data. P-values were calculated to compare start with end samples of composting for all four compost piles combined (average of the triplicate end samples, no differentiation of the treatments).