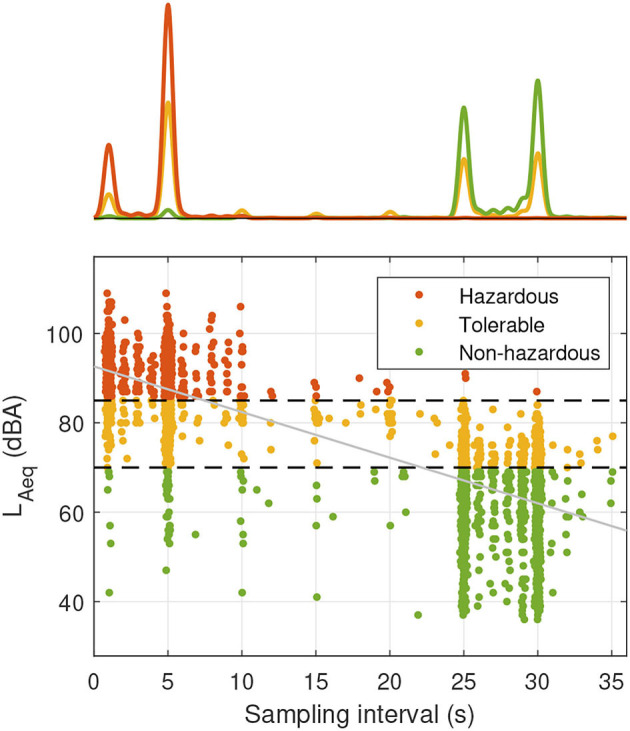
Figure 3.

Scatter plot with histogram representing the relationship between smartwatch samples LAeq and sampling interval for different sound pressure level categories. The smartwatch sampling intervals are automatically adjusted by the device and have integer values of seconds; jitter was added to improve visibility. The black dashed lines indicate the threshold values for sound pressure level categorization (70 and 85 dBA, respectively). The least-squares regression line is depicted in gray.
