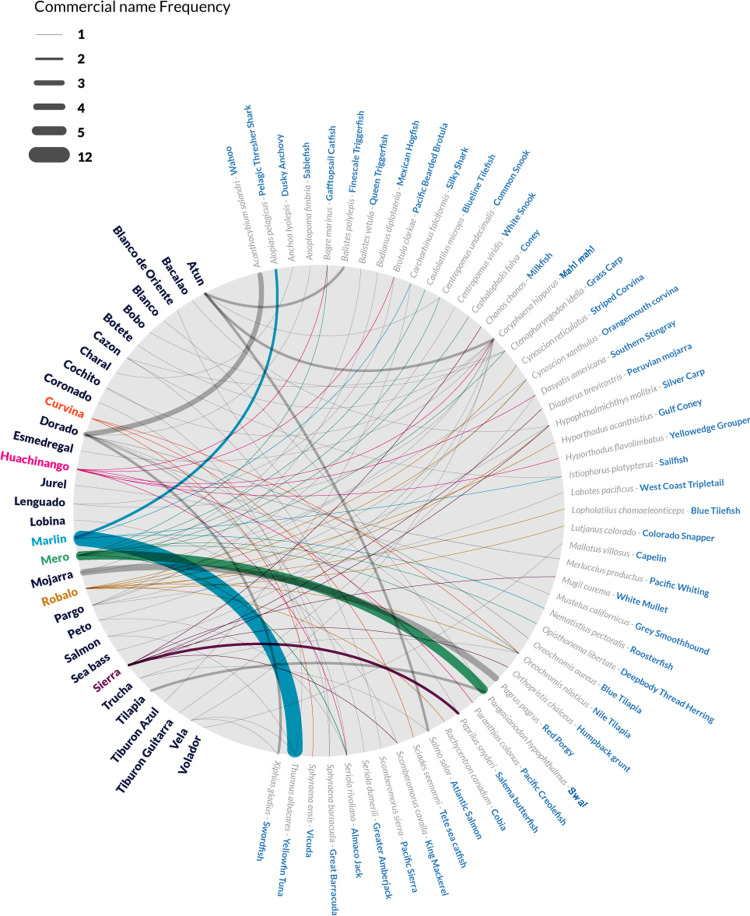
Fig 1. Alluvial plot showing the patterns of 116 instances of mislabeling found in Mexico, displayed as a network connecting 53 species used as substitutes for 32 commercial names that created 90 unique combinations under which samples were mislabeled.
Line widths represent the frequency of a given mislabeling combination (thickest line = 12 events). The six commercial names with the highest frequency of mislabeling are shown with distinct colors.

