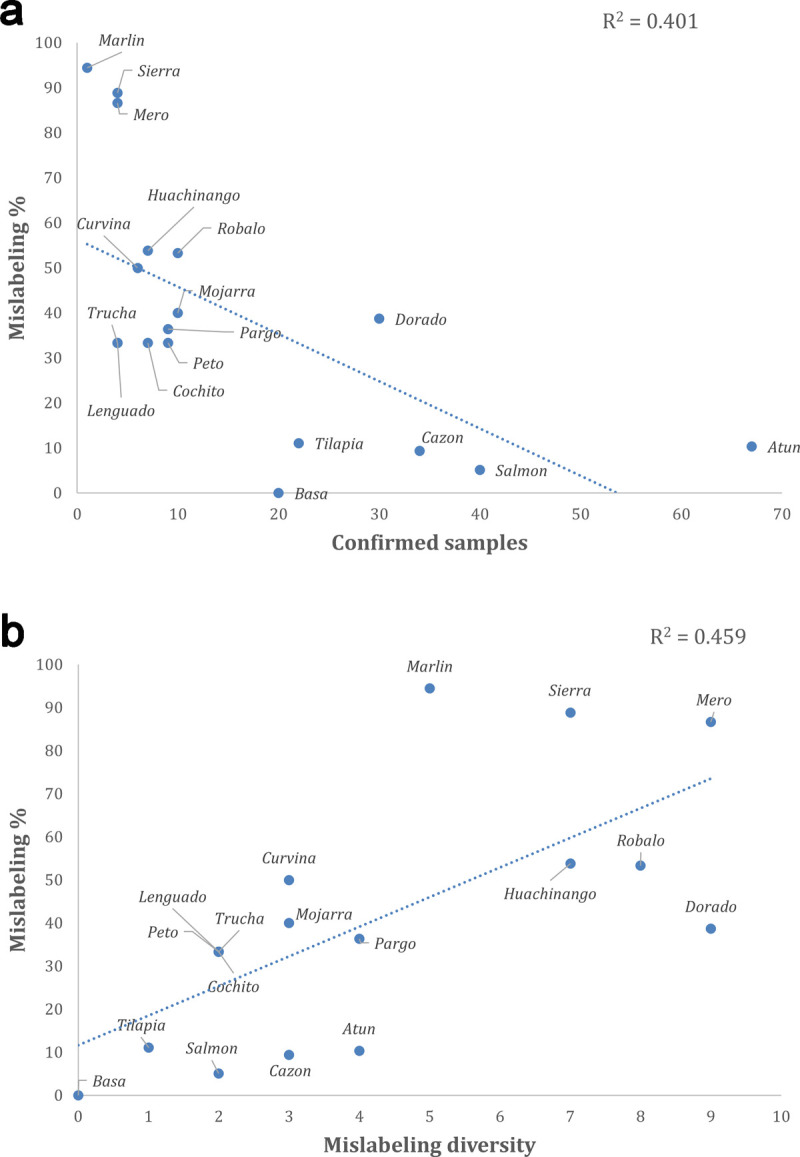
Fig 3.

Linear regression analyses showing: A) the relationship of net availability of a species in our dataset (Confirmed number of samples, excluding mislabeling and including samples used to substitute other species) as a predictor of mislabeling rates for the 18 most important commercial names found within three cities of Mexico; B) the relationship of the number of substitute species sold under the name of the focal species (Mislabeling diversity, a proxy of demand for commercial species in our dataset) as a predictor of mislabeling rates.
