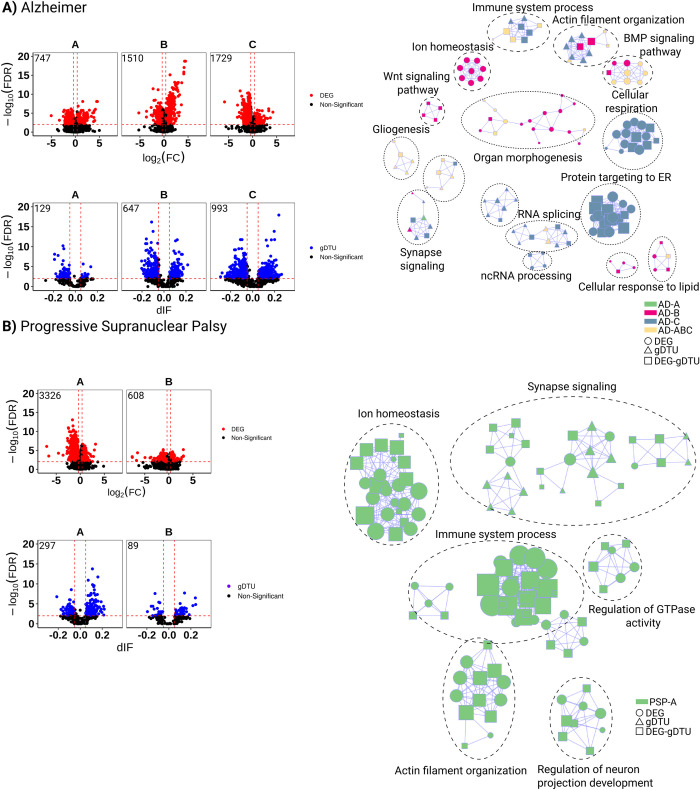
Fig 2. Gene expression alterations in the temporal cortex of AD and PSP patients.
A) Volcano plots (left) showing differentially expressed genes (DEGs, red dots; FC > 1.3 and FDR < 0.01), genes with differential transcript usage (gDTU, blue dots; Differential isoform fraction (dIF) and FDR < 0.01) and a network representation (right) of gene ontologies (GOs) significantly enriched in AD. Circles, triangles and squares indicate, respectively, GOs enriched for DEGs, gDTUs or a combination of both. Colors in the network indicate groups where gene expression alterations were detected. B) Same for PSP. Numbers of significantly altered genes identified in each analysis are shown in the top left corner of the volcano plots.

