
Fig. 3. Pro-IL-12 could effectively control both primary and metastatic tumors.
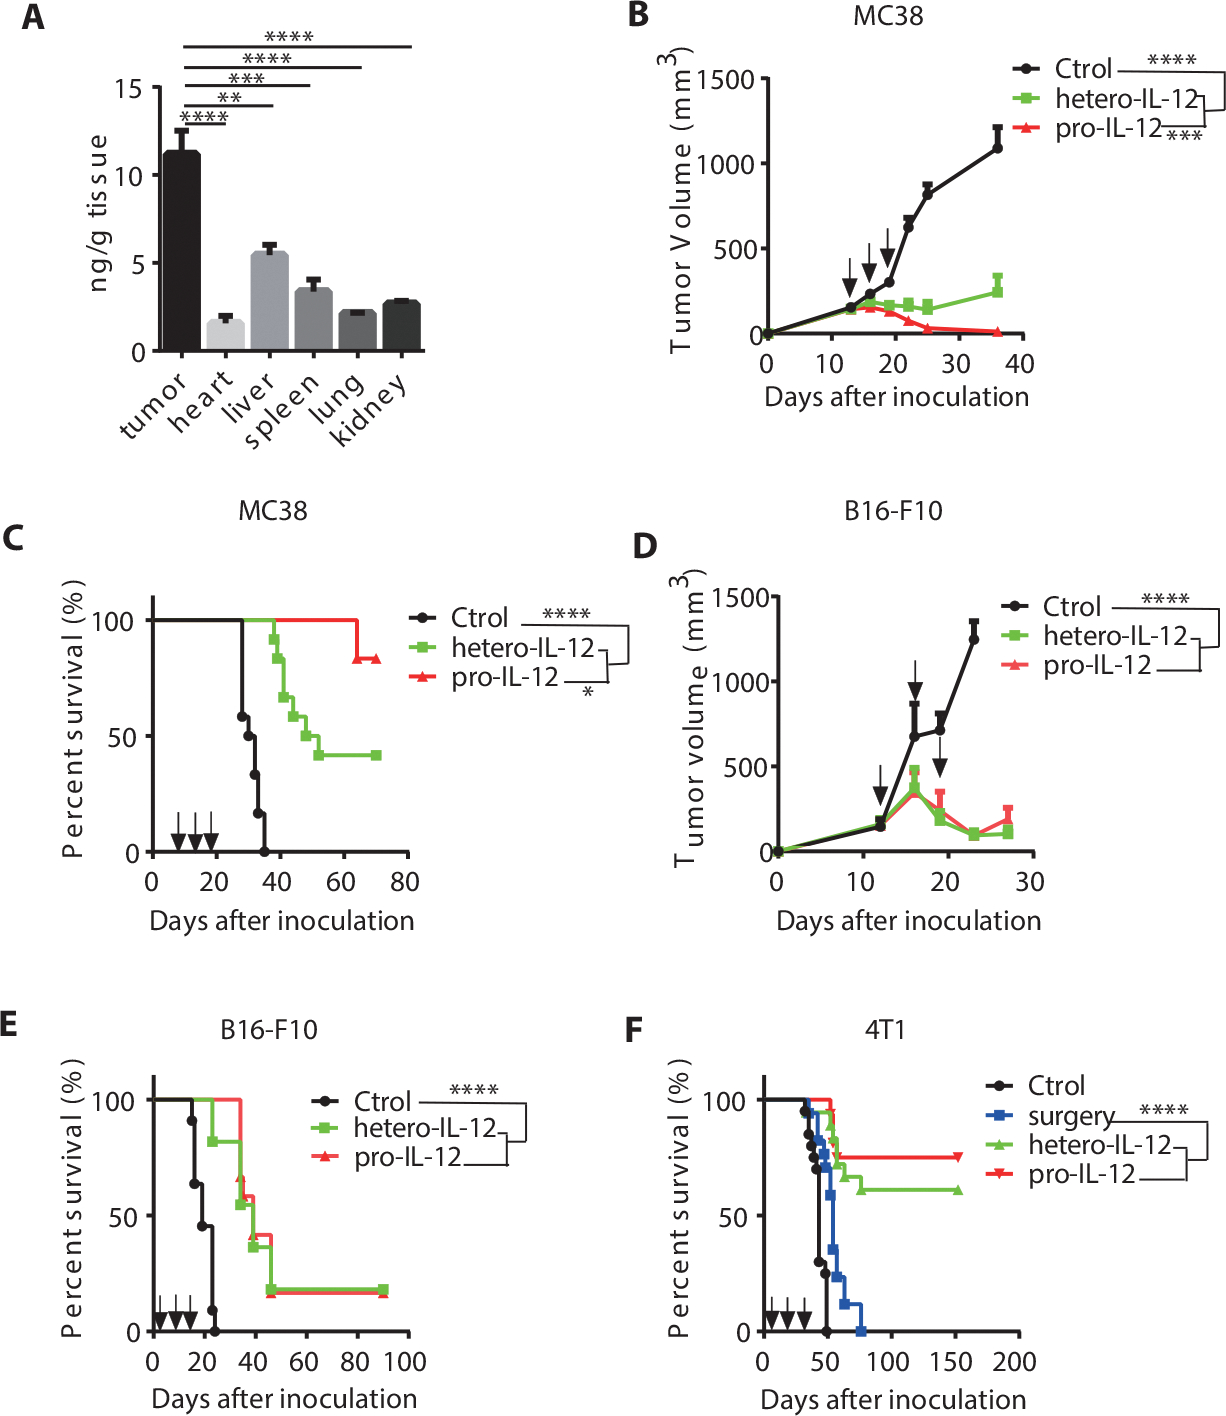
(A) Biodistribution of pro-IL-12 in various tissues after 2.4 μg pro-IL-12 was injected i.p. into MC38 tumor-bearing mice (n=6/group). HIgG ELISA was performed to quantify the amount pro-IL-12 in each homogenate, normalized by total tissue weight.
(B-C) Tumor growth and survival curves of C57BL/6N mice (n=12/group) inoculated with 5×10⁵ MC38 cells and then treated with PBS, 3.33pmol of hetero-IL-12-Fc, or pro-IL-12 by i.p. injection on days 13, 16, and 19. Tumor size was measured twice per week (B), and the mouse survival curve was shown as (C).
(D-E) Tumor growth and survival curves of C57BL/6N mice inoculated with 3×10⁵ B16-F10 cells and then treated with PBS (n=8), 33.3pmol of hetero-IL-12-Fc (n=11), or pro-IL-12 (n=11) by i.p. injection on days 13, 16, and 19. Tumor size was measured twice per week (D), and the mouse survival curve was shown in (E).
(F) Survival curves of BALB/C mice inoculated with 1.5×10⁵ 4T-1 cells and then treated with PBS(n=20), 3.33pmol of hetero-IL-12-Fc (n=18), or pro-IL-12 (n=16) by i.p. injection on days 9, 12, and 15 or only surgery (n=17). All primary tumors were resected on day 16, except for the no-surgery group, as a control.
Data indicate mean ± SEM and are repeated two or three independent experiments. Statistical analysis for A and D was performed using unpaired two-tailed t-tests. For B, a two-way analysis of variance (ANOVA) was applied. Statistical analysis for the survival curve data was performed using log-rank tests.*P <0.05, **P < 0.01, ***P < 0.001, and ****P < 0.0001.