
Fig. 6. Pro-IL-12 in combination with TKI and anti-PD-L1 anti-tumor therapies.
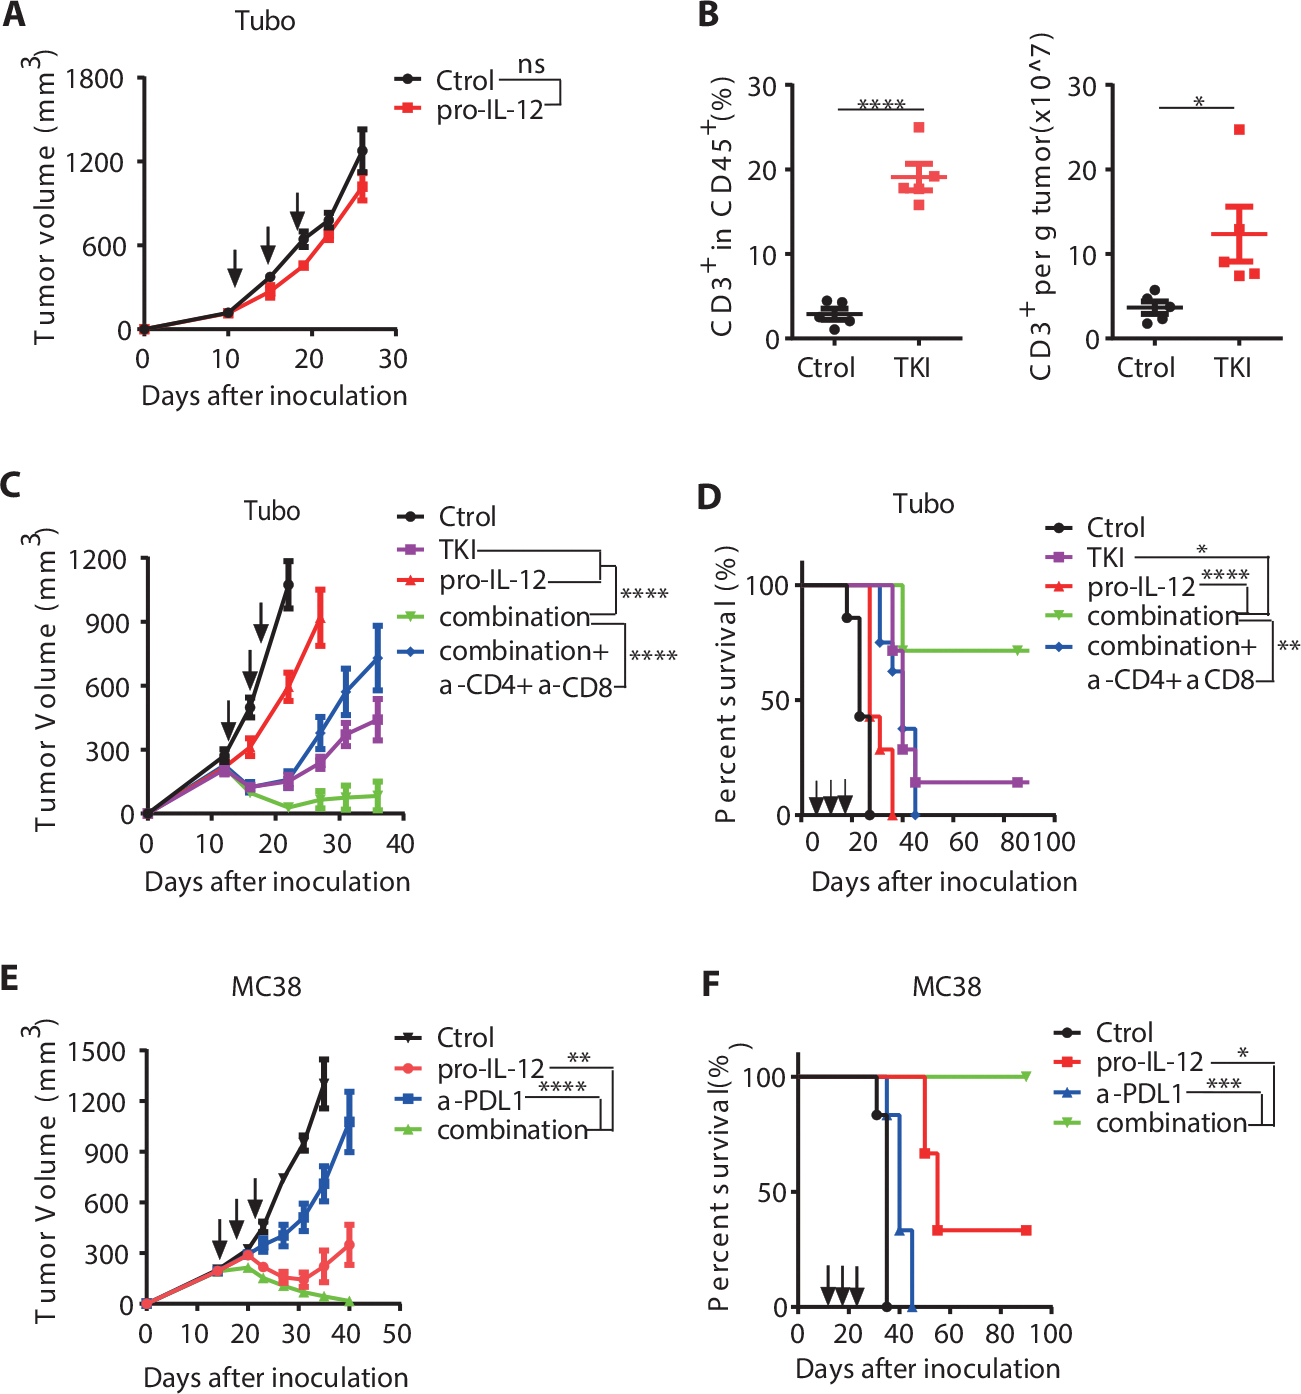
(A) Tumor growth curves of BALB/C mice (n=7/group) that were inoculated with 5×10⁵ TUBO cells and then treated with PBS or 3.33pmol pro-IL-12 by i.p. injection on days 12, 15, 18. Tumor growth was measured twice per week.
(B) Absolute number and percent of CD3+ T cells within tumors of BABL/C mice inoculated with 5×10⁵ TUBO cells and then treated with 1mg of TKI through oral gavage on days 13 and 18. Total T cell ratio and number were detected by flow cytometry six days after the first TKI treatment (n=5/group). Tumor growth was measured at the indicated time points for TKI treatment in (Supplementary Fig. 8A).
(C-D) Tumor growth curves of BABL/C mice (n=7/group) inoculated with 5×10⁵ TUBO cells and then treated with PBS, TKI, pro-IL-12, or both. 1mg of TKI was given through oral gavage on days 13 and 18, whereas 6.67 pmol of pro-IL-12 was injected i.p. on days 13, 16, 19. An additional combination treatment group (n=8) was given 200 μg of depleting anti-CD8 and anti-CD4 antibody by i.p. injection alongside pro-IL-12 treatment every 3 days for a total of three doses. Tumor size was measured twice per week (C), and the mouse survival curve was shown as (D).
(E-F) Tumor growth curves of C57BL/6N mice (n=6/group) inoculated with 5×10⁵ MC38 cells and then treated with PBS, pro-IL-12, anti-PDL1, or both. 3.33pmol of Pro-IL-12 was injected i.p. on days 15, 18, and 21, whereas 200μg of anti-PDL1 was injected i.p. on days 15, 19, and 23. Tumor size was measured twice per week (E), and the mouse survival curve was shown as (F).
Data indicate mean ± SEM and are repeated two or three independent experiments. Statistical analysis for B was performed using unpaired two-tailed t-tests. For A, C and E, a two-way analysis of variance (ANOVA) was applied. Statistical analysis for the survival curve data was performed using log-rank tests.*P <0.05, **P < 0.01, ***P < 0.001, and ****P < 0.0001.