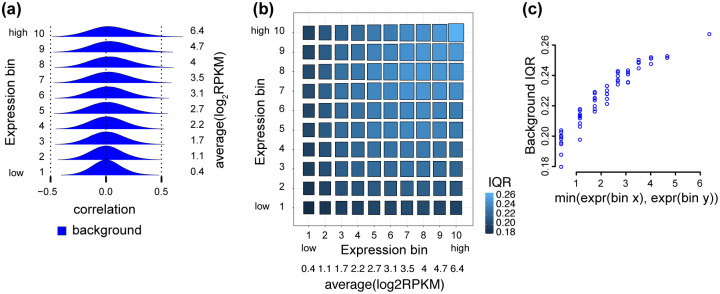
Fig 2. The mean-correlation relationship between gene expression level and the distribution of observed gene-gene correlations.
The distribution of Pearson correlations of gene pairs using 350 RNA-seq samples from adipose subcutaneous tissue, with 4 PCs removed. (a) Densities of the Pearson correlation between gene pairs stratified by overall expression (10 bins ranging from low to high expression). Average expression level for each expression bin is given by the values to the right of the densities. (b) A 2D boxplot where each box represents the IQR of the Pearson correlations between all genes (termed background IQR) in a submatrix of the correlation matrix corresponding to two bins of expression. (c) The relationship between IQRs of the Pearson correlations between all genes in a submatrix (y-axis), and the minimum between the average expression level of the two bins associated with the submatrix (x-axis).

