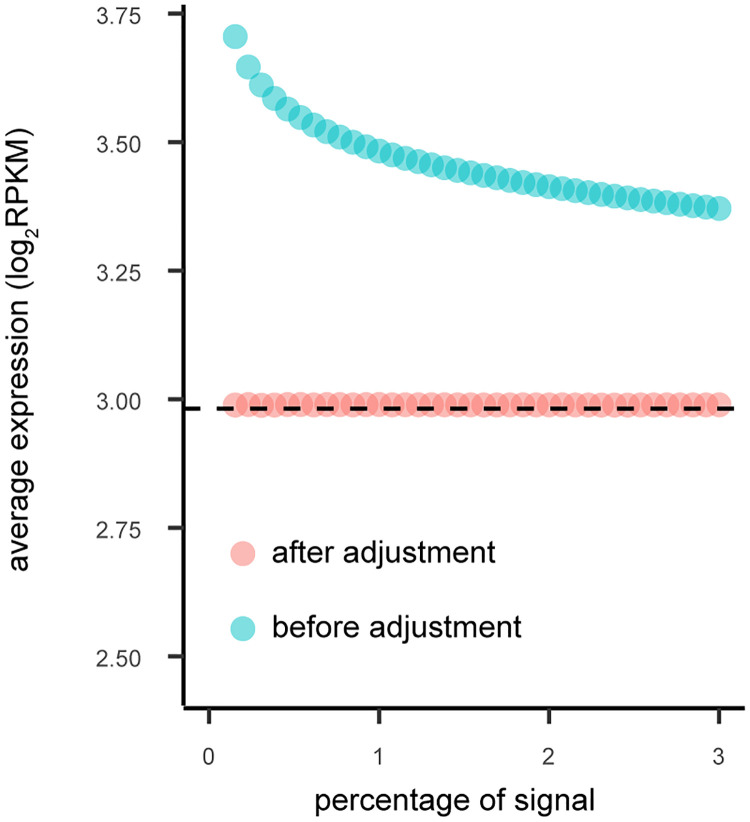
Fig 8. The relationship between the signal threshold (in percentage) and the expression level (before and after SpQN adjustment).
We define the co-expression signal threshold (x-axis) as the top percentage of absolute correlation values (ranging between 0 and 3%). For a given signal threshold, we calculate the average expression level (y-axis), before (blue) and after SpQN (pink). The average gene expression level is shown by the dotted black line. Data is from the Adipose subcutaneous tissue with 4 PCs removed, see Fig G in S1 Text for all 9 tissues.

