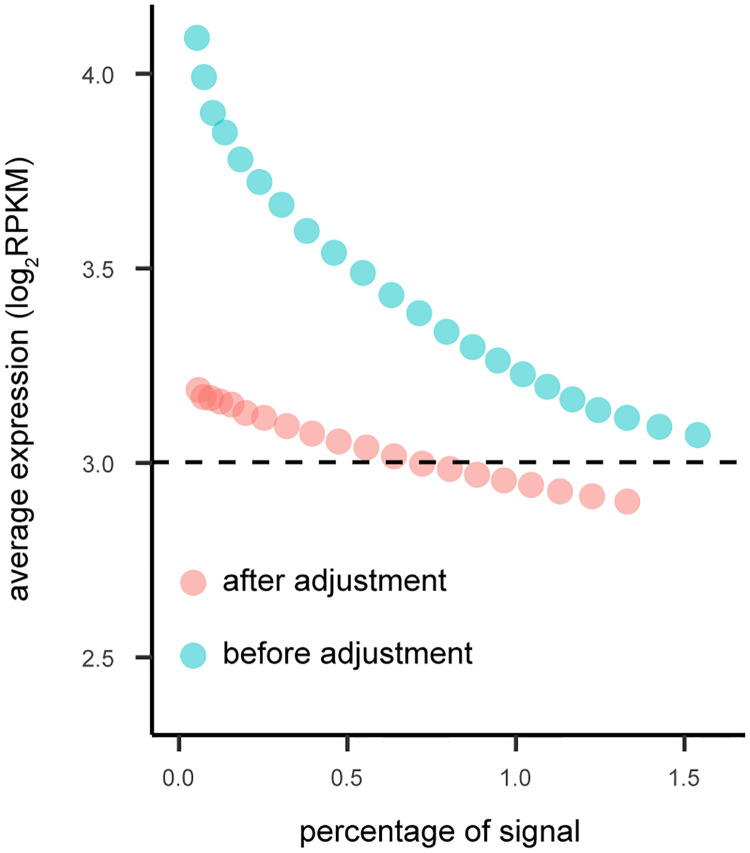
Fig 9. The expression bias in graphical lasso network inference.
The expression levels of networks inferred by graphical lasso. Different values of the tuning parameter (ρ) results in different network sizes (x-axis) with higher values of the tuning parameter leading to smaller networks. The average gene expression is shown by the dotted black line. Data is from Adipose subcutaneous with 4 PCs removed, see Fig I in S1 Text for additional tissues.

