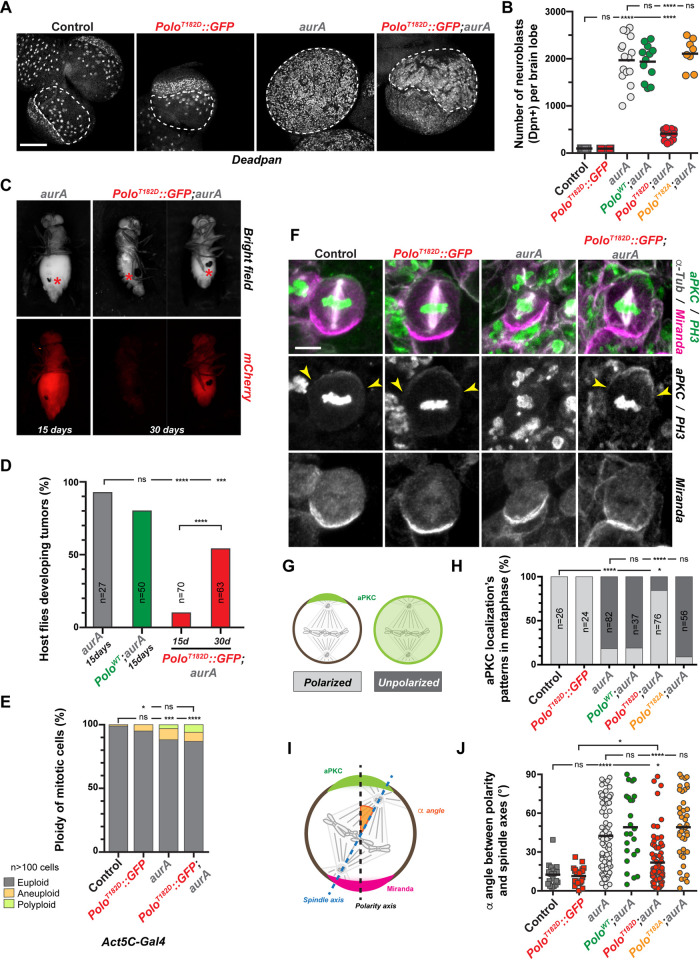
Fig 5. Activation of Polo restores NSCs polarization, spindle orientation and inhibits tumor growth in an aurA mutant.
A) Representative images of fixed control and aurA mutant larval brain lobes with or without PoloT182D::GFP expression and stained for the NSC marker Deadpan. The white dashed lines outline the central brain area where NSCs were scored. Note that the expression PoloT182D in aurA mutant restores the delimitation between the central brain and neuroepithelium. Scale bar: 100 μm. B) Quantification of the NSC number in each brain lobe for the indicated genotypes. C) Examples of wild-type adult host flies 15 and 30 days after transplantation with aurA mutant or aurA mutant expressing PoloT182D::GFP brain lobes expressing mCherry::Tubulin as a readout to follow tumor development. Red asterisks indicate transplantation scars. D) Percentage of host flies developing tumors 15 and 30 days after the transplantation of brain lobes from the indicated genotypes. E) Quantification of ploidy defects scored in neural tissue for the indicated genotypes. The proportion of euploidy was compared to the proportion of ploidy defects for statistical analyses. F) Representative images of control, PoloT182D::GFP, aurA mutant and PoloT182D::GFP;aurA metaphase NSCs stained for Miranda (magenta in the merge), aPKC and Phospho-Histone H3 (green in the merge), and α-Tubulin (white in the merge). Yellow arrowheads indicate the edges of aPKC crescent. Scale bar: 5 μm. G) Schematic representation of aPKC localization patterns observed in NSCs: left: aPKC forms a crescent which defines the apical cortex of the control cell; right: aPKC is unpolarized and exhibits a homogenous cytoplasmic and cortical localization. H) Percentage of NSCs of the indicated genotypes with either a polarized apical crescent (light grey) or homogenous cortical and cytoplasmic aPKC localization (dark grey). I) Schematic illustration of the method used to measure the spindle alignment α angle (orange) between the polarity axis (black dashed line), determined by aPKC (green) and Miranda (magenta), and the spindle axis (blue dashed line) determined by spindle poles (See Material and Methods). J) Quantification of the α angle between polarity and spindle axes in metaphase NSCs for the indicated genotypes. Mann-Whitney unpaired test: ns: p>0.05; ****: p<0.0001. Means are shown as black bars. For panels D), E) and H): Fisher’s exact test: ns: p>0.05; *: p<0.05, ***: p<0.001; ****: p<0.0001.

