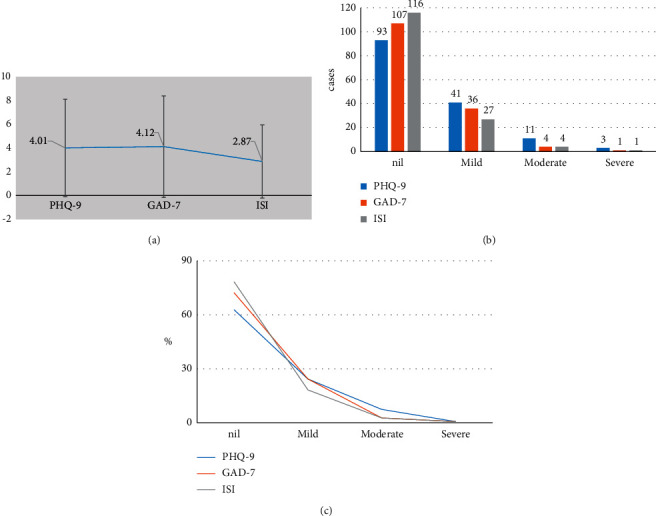
Figure 9.

n-RFC data analysis diagram of the general results of 148 nursing personnel in the past 2 weeks by PHQ-9, GAD-7, and ISI, respectively. (a) The average scores of three scales, and error bars denoted the average score standard deviation of each scale of 148 nursing personnel. (b) The population statistics. (c) The general proportion of each level.
