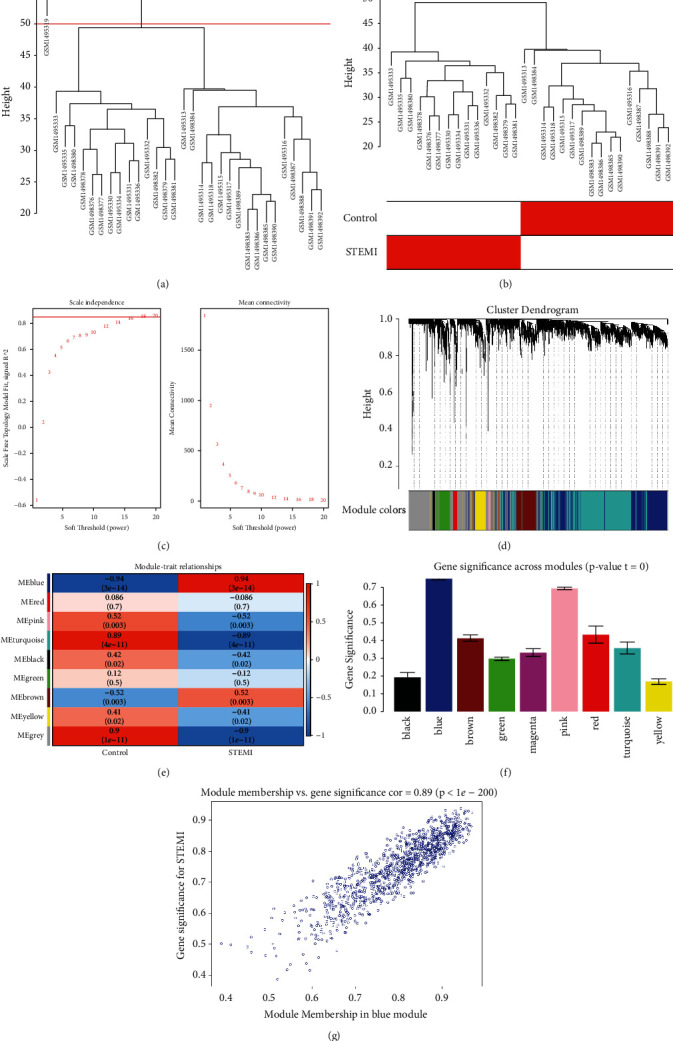
Figure 3.

WGCNA. (a) Clustered sample. (b) Sample dendrogram and trait heatmap. (c) Analyzed network topology for various soft thresholding powers. (d) Clustered dendrogram of genes. (e) Heatmap of the module-trait relationships. (f) Gene significance across modules. (g) Blue module.
