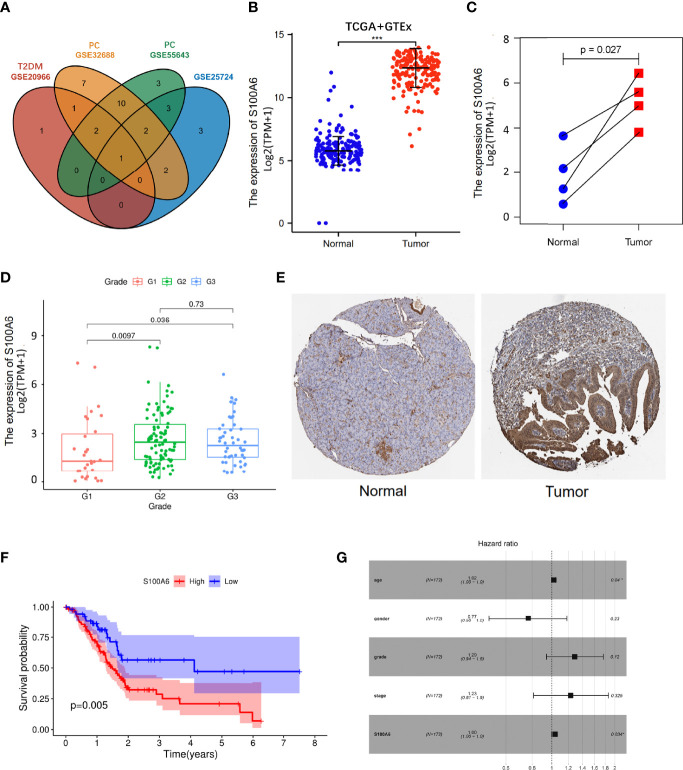
Figure 5.
S100A6 expression and prognostic value in PC tissues. (A) Venn diagram of the shared genes in T2DM and PC in validation cohorts. (B, C) The expression levels of S100A6 in normal and PC tissues. (E) Representative IHC staining of S100A6 in normal and PC tissues from HPA database. (F) K-M curve of association of S100A6 and PC patients’ OS in TCGA cohort. (G) Multivariate Cox analysis of prognostic variables in PC patients. T2DM, type 2 diabetes mellitus; PC, pancreatic cancer; IHC, immunohistochemistry; K-M, Kaplan–Meier; OS, overall survival. ∗p < 0.05 and ∗∗∗p < 0.001.

