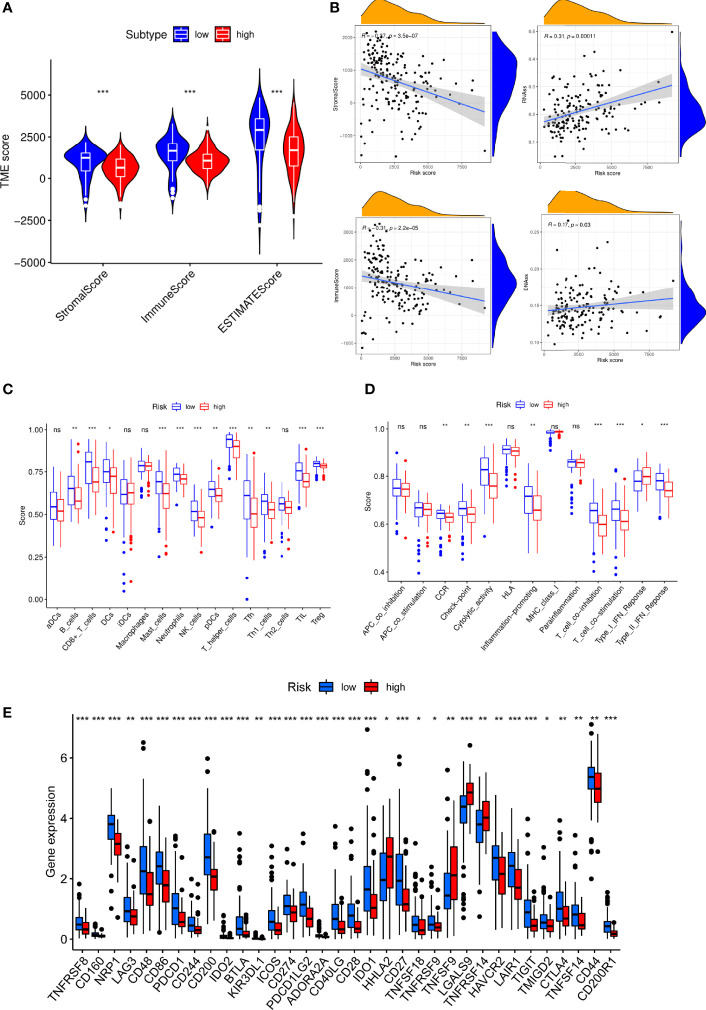
Figure 8.
Immune microenvironment analysis in PC patients with high and low S100A6 expression. (A) Comparison of ESTIMATE Score, Stromal score, and Immune score between S100A6-high and S100A6-low groups by ssGSEA algorithm. (B) Relationship of S100A6 expression and RNAss, DNAss, Stromal Score, and Immune Score. (C) Comparison of immune cell subsets, (D) immune-related functions, (E) immune checkpoints between S100A6-high and S100A6-low groups. PC, pancreatic cancer; ssGSEA, single-sample Gene Set Enrichment Analysis. ns, no significance, ∗p < 0.05, ∗∗p < 0.01, and ∗∗∗p < 0.001.

