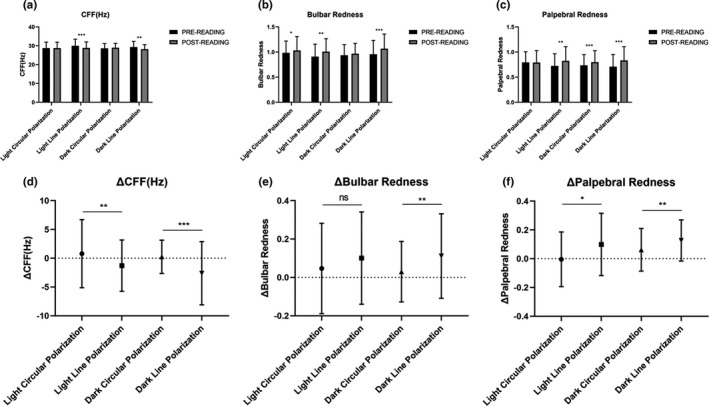
FIGURE 3.

Influence of circularly and linearly polarized smartphone on asthenopia examination. (a–c) Shows data presented as mean ± SD. a–c Demonstrated the differences of CFF, bulbar redness, and palpebral redness between post‐ and pre‐reading, respectively. (d–f) Shows the Δ differences of above objective measurements between circular and linear groups under two separated environments (Δ = post–pre). *p ≤ 0.05, **p ≤ 0.01, ***p ≤ 0.001. CFF, confusion flicker frequency
