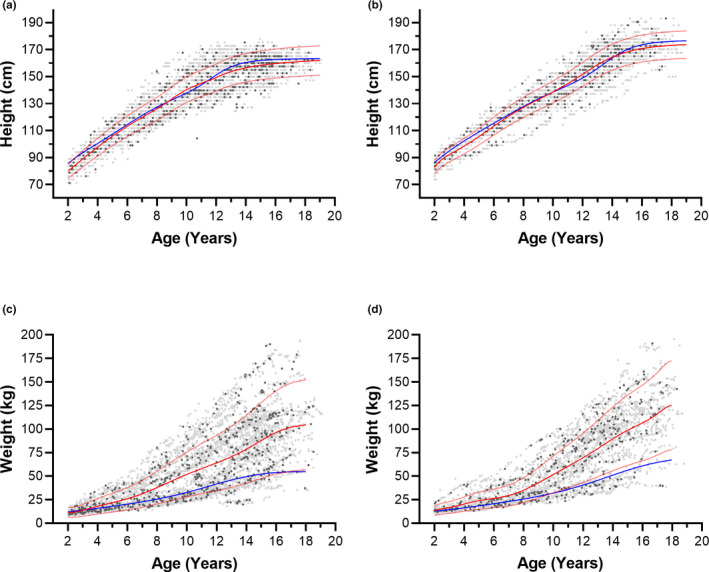
FIGURE 2.

Height or weight of children who develop type 2 diabetes mellitus versus age compared with patient‐specific model of growth (red) or the 50th percentile CDC model (blue). (a) height, females (b) height, males (c) weight, females (d) weight, males. Grey symbols, training set; black symbols, testing set. Faint red lines correspond to the standard deviation, derived from the coefficient of variation (%) of the datapoints from the model. CDC, Centers for Disease Control and Prevention
