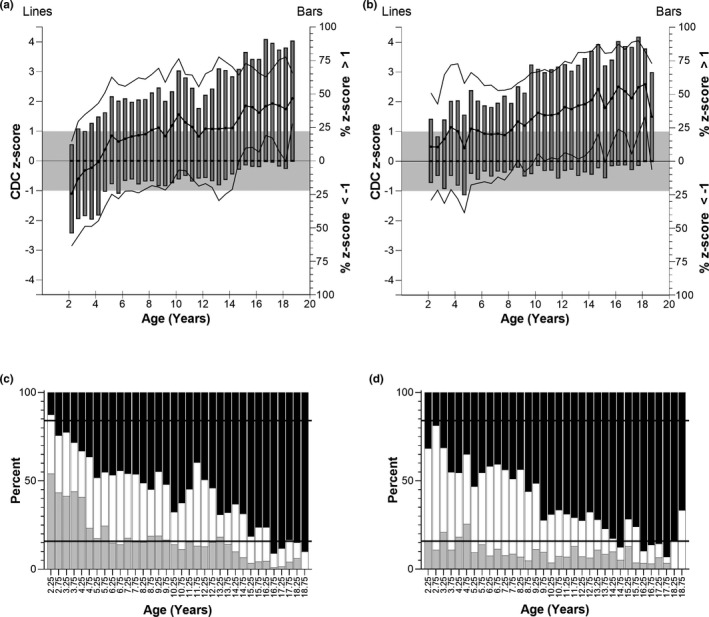
FIGURE 4.

Top panels: CDC z‐scores of weight for T2DM children. (a) Female patients, (b) male patients. Left y‐axis: CDC z‐score of T2DM children (mean (bold lines) ± SD (faint lines)) binned into 6‐month intervals. The grey box indicates one SD above and below the average CDC weight (z = 0). Right y‐axis: Bars represent the percent of T2DM children in the age bin with z‐score greater than 1 or less than −1. Bottom panels: Distribution of patient weight z‐scores greater than 1 (black bars), between −1 and 1 (white bars), and less than −1 (grey bars). (c) Female patients, (d) male patients. The expected distribution if T2DM patients at each age and sex corresponded to the CDC range would be that 15.9% of patients would fall below −1 (lower horizontal line), 68.2% would fall between the lines, and 15.9% would be greater than 1 (upper horizontal line). CDC, Centers for Disease Control and Prevention; T2DM, type 2 diabetes mellitus
