FIGURE 5.

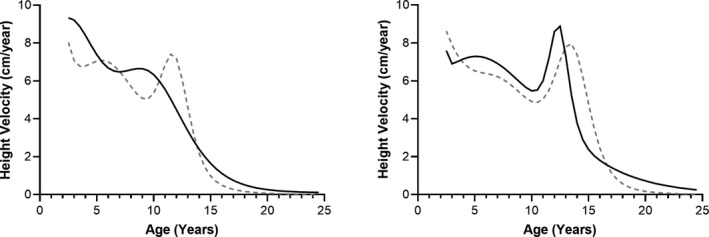
Velocity of height growth per year. Left: female, right: male. The first derivative of the growth models. Grey dashed lines, CDC; black lines, type 2 diabetes. CDC, Centers for Disease Control and Prevention

Velocity of height growth per year. Left: female, right: male. The first derivative of the growth models. Grey dashed lines, CDC; black lines, type 2 diabetes. CDC, Centers for Disease Control and Prevention