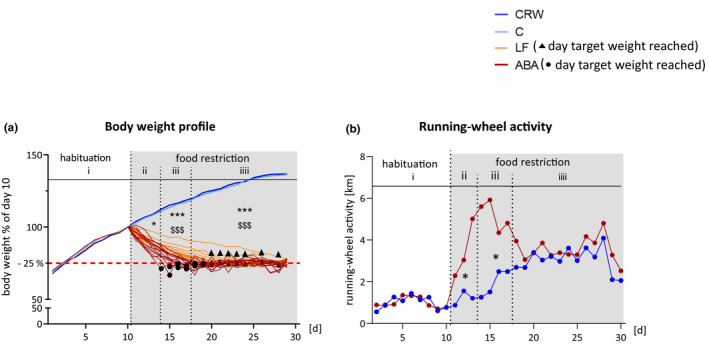
FIGURE 1.

Body weight and running‐wheel activity profiles. (a) Average body weight in % of day 10. Individual body weight profiles are depicted for LF and ABA rats during the food restriction period. Black dots and rectangles represent the day target weight was reached in ABA and LF rats, respectively. (b) Mean RWA normalized to the average RWA of the habituation period: (i) habituation, (ii) induction of starvation, (iii) acute starvation, and (iv) chronic starvation. Differences between four groups were calculated with one‐way ANOVA and Bonferroni correction and between two groups with two‐sided Student’s t‐test. * Represents differences between control and LF, $ represents differences between CRW and ABA. ABA, activity‐based anorexia; C, control; CRW, control+running‐wheel; LF, limited food; RWA, running‐wheel activity. */$ = p ≤ 0.05, ***/$$$ = p ≤ 0.001
