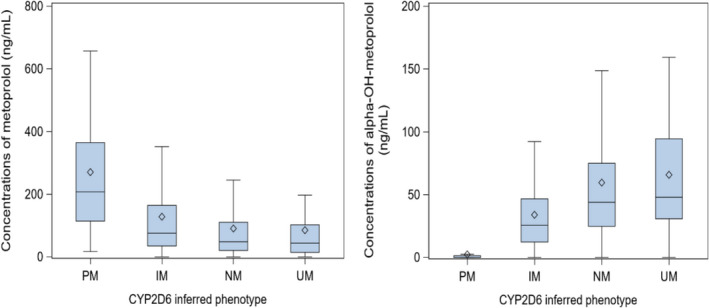
FIGURE 1.

Plasma concentrations of metoprolol and α‐OH‐metoprolol. Concentrations of metoprolol (left) and α‐OH‐metoprolol (right) by CYP2D6‐inferred phenotype. Data presented as untransformed values. IM, intermediate metabolizer; NM, normal metabolizer; PM, poor metabolizer; UM: ultrarapid metabolizer. Central bar of the box: median; lower bar of the box: first quartile; upper bar of the box: third quartile; diamond: mean; bar below the box: minimum (excluding outliers); bar above the box: maximum (excluding outliers)
