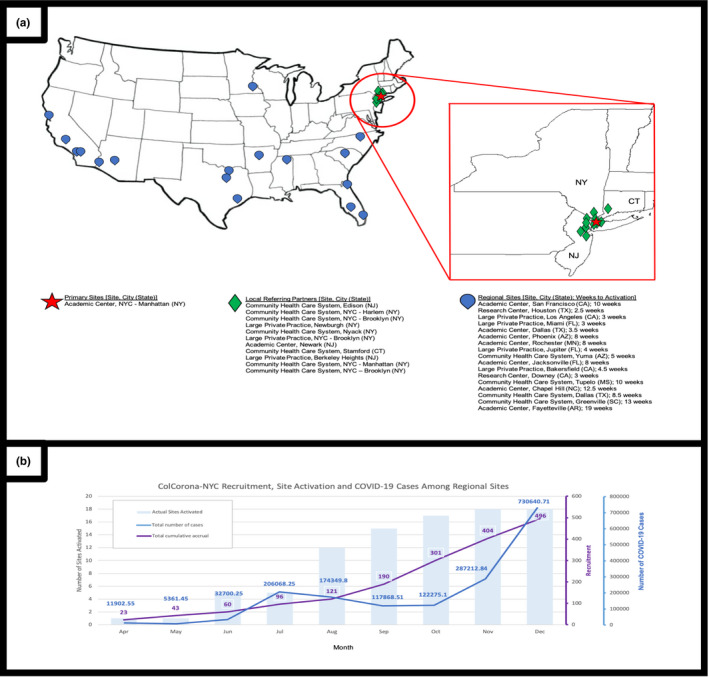
FIGURE 1.

(a) Map and activation of local referring partners and regional recruiting sites in the United States. (b) Activation of regional sites and participant enrollment compared to local infection numbers. The bars represent the number of regional sites with active trial enrollment. The purple line represents the cumulative total of recruited participants in ColCorona‐US, enrolled among all active regional sites at the time. The blue line represents the number of COVID‐19 cases (based on daily rolling averages from the CDC 13 ), among US counties with an active ColCorona‐US recruiting site. CDC, Centers for Disease Control and Prevention; COVID‐19, coronavirus disease 2019; CT, Connecticut; NJ, New Jersey; NY, New York; NYC, New York city
