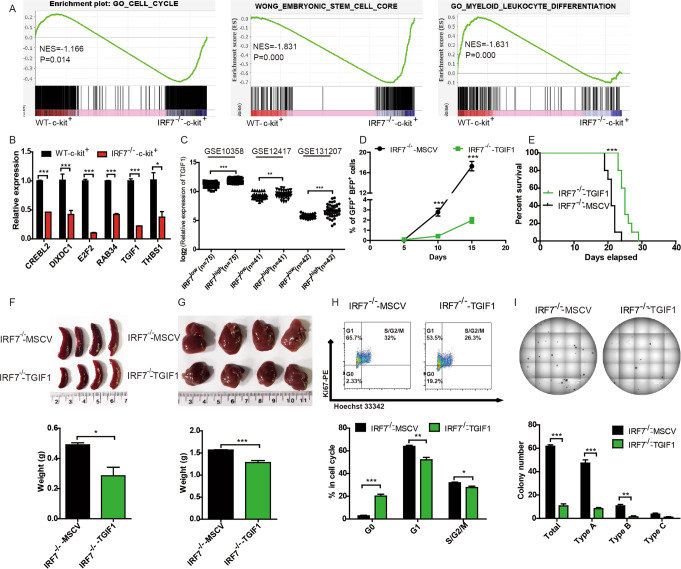
Fig. 4. Downregulation of TGIF1 contributes to malignant phenotypes in AML-IRF7−/− cells.
A The enrichment of annotations of cell cycle, embryonic stem cell core, and myeloid leukocyte differentiation between AML-IRF7−/−-c-kit+ and AML-WT-c-kit+ cells by GSEA. B The expression of selected genes was analyzed by qRT-PCR. C The expression of TGIF1 between the IRF7high group (top 30% cases) and IRF7low group (bottom 30% cases) in the GSE10358, GSE12417, and GSE131207 datasets are shown. D, E Equal numbers of AML-IRF7−/−-MSCV and AML-IRF7−/−-TGIF1 cells were transplanted into recipient mice. D The percentage of peripheral blood AML cells was monitored every 5 days (n = 5). E The survival of mice is shown in Kaplan–Meier curves (n = 10 for each group). F–I The mice received transplantation of equal numbers of AML-IRF7−/−-MSCV and AML-IRF7−/−-TGIF1 cells on day 0 and were sacrificed on day 18. The sizes (upper) and weights (lower) of spleens (F) and livers (G) are shown. H GFP+BFP+ cells were stained with Ki67 and Hoechst 33342. Representative results are shown (upper), and the percentages of G0, G1, and S/G2/M phase AML cells are plotted (lower). I Secondary colony formation experiments were performed by seeding 500 sorted AML cells per well into 24-well plates. Representative results are shown (upper), and the colony numbers are plotted (lower). Data are presented as mean ± S.E.M. Unpaired Student’s t test, one-way ANOVA tests and Kaplan–Meier estimates were used. *p < 0.05; **p < 0.01; ***p < 0.001.

