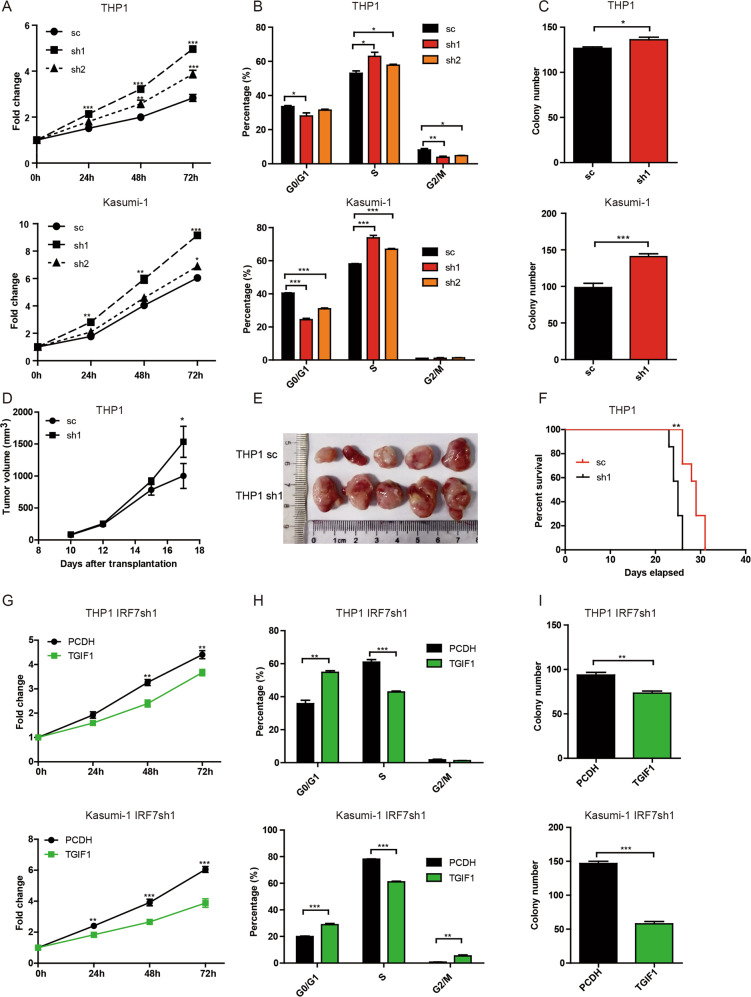
Fig. 5. Knockdown of IRF7 promotes proliferation and increases LSC levels in human AML cell lines.
A–C THP1 and Kasumi-1 cells were infected with pLV-IRF7sc, pLV-hIRF7sh1 and pLV-hIRF7sh2 lentiviruses. The GFP+ cells were sorted by flow cytometry. A Equal numbers of cells were seeded in 96-well plates for the MTS assay. The proliferation of cells is shown as the fold change against the OD value at 0 h. B The percentages of G0/G1, S, and G2/M phase cells assessed by BrdU and 7-AAD staining experiments are plotted. C Colony formation experiments were performed by seeding 500 sorted AML cells per well into 24-well plates. The colony numbers are plotted. D, E The nude mice were subcutaneously inoculated with an equal number of GFP+ cells on day 0 and sacrificed on day 17. The dynamic tumor volume is plotted (D) and the size of tumors are shown (E). F The NSG mice were intravenously transplanted with an equal number of GFP+ cells on day 0. The survival of mice is shown in Kaplan–Meier curves (n = 7 for each group). G–I THP1 IRF7sh1 and Kasumi-1 IRF7sh1 cells were infected with blank or PCDH-EF1α-hTGIF1-mRFP lentivirus. The GFP+RFP+ cells were sorted by flow cytometry. G Equal numbers of cells were added to 96-well plates for the MTS assay. The proliferation of cells is shown as the fold change against the OD value at 0 h. H GFP+RFP+ cells were stained with BrdU and 7-AAD. The percentage of G0/G1, S and G2/M phase cells is plotted. I Colony formation experiments were performed by seeding 500 AML cells per well into 24-well plates. The colony numbers are plotted. Data are presented as mean ± S.E.M. Unpaired Student’s t test and one-way ANOVA tests were used. *p < 0.05; **p < 0.01; ***p < 0.001.

