Fig. 5.
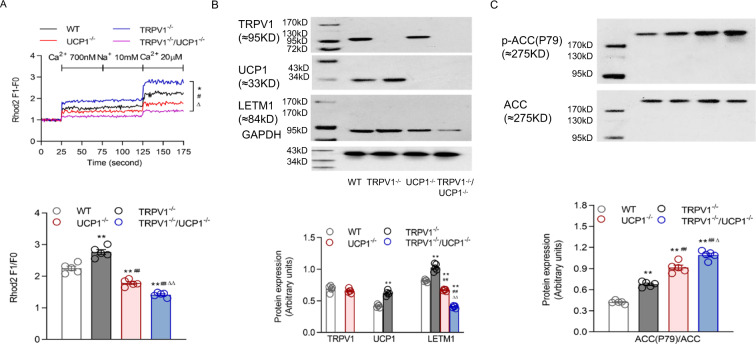
TRPV1 and UCP1 double knockout impaired mitochondrial ion balance. A Mitochondrial [Ca2+] of primary cultures of brown adipocytes from WT, TRPV1−/−, UCP1−/− and TRPV1−/−/UCP1−/− mice was measured after loading with Rhod2 (2 μmol/L). The lower panel is the bar graph derived from the upper figure with [Ca2+] at 20 μM. B, C Immunoblots of TRPV1, UCP1, and LETM1 (B); ACC (P79); and ACC (C) in the BAT of WT, TRPV1−/−, UCP1−/− and TRPV1−/−/UCP1−/− mice. Values are presented as the means ± SEM for five experiments (the third row corresponds to the panel of the second row). *P < 0.05, **P < 0.01 vs. WT mice; #P < 0.05, ##P < 0.01 vs. TRPV1−/− mice; ∆P < 0.05, ∆∆P < 0.01 vs. UCP1−/− mice

