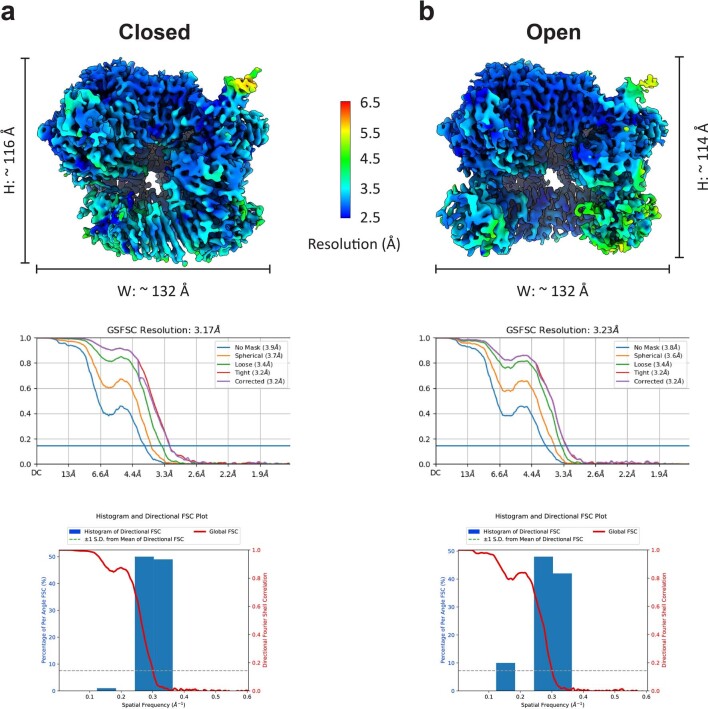
Extended Data Fig. 3. Resolution estimations of the closed (a) and open (b) states of the Rad24-RFC–9-1-1–DNA complex.
Upper panels, the two 3D maps colored by local resolution. The dimensions of the structures are labeled. Middle panels, the 0.143 criterion of the gold standard Fourier shell correlation (GSFSC) was used to estimate the average resolutions. Bottom panels, the directional anisotropy of the two maps as quantified by the 3D-FSC server (https://3dfsc.salk.edu/). The sphericity of closed and open state is 0.949 and 0.923, respectively, demonstrating good anisotropic property of both maps.

