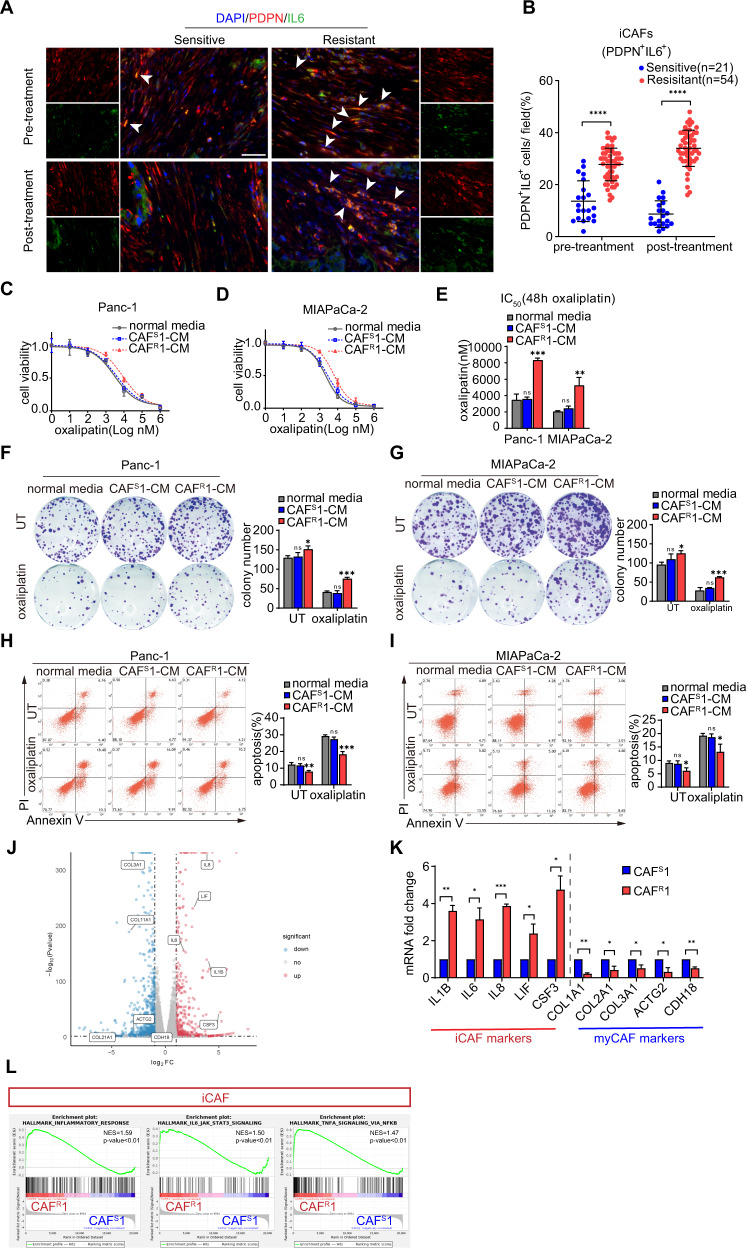
Fig. 1. CAFs were correlated with a poor survival and platinum resistance in pancreatic cancer patients.
A Representative immunofluorescence images of advanced pancreatic cancer biopsies before and after chemotherapy. Arrows indicate iCAFs: PDPN +IL6+. Scale bar = 50 μm. Quantification of the presence of iCAFs (B). Panc-1 and MIAPaCa-2 cells were cultured under CAFS1-CM or CAFR1-CM for 3 days and then subjected to the indicated experiments. C–E Cells were treated with oxaliplatin for 48 h. Cell viability was measured by CCK-8 and the IC50 value was calculated. F, G Colony formation assay and (H, I) flow cytometry apoptosis analyses were performed to evaluate the chemoresistance of pancreatic cancer cells in each group. J Volcano plot of differentially expressed genes from the mRNA transcriptomes of CAFS1-CM and CAFR1-CM. Three biological replicates of each CAF cell line were used for the RNA sequencing. K Expression level of specific genes in CAFS1-CM and CAFR1-CM. L GSEA of significantly upregulated pathways in CAFR1 compared with CAFS1. The results are presented as the mean ± SD of three technical replicates. *P < 0.05; **P < 0.01; ***P < 0.001, ns no significance.

