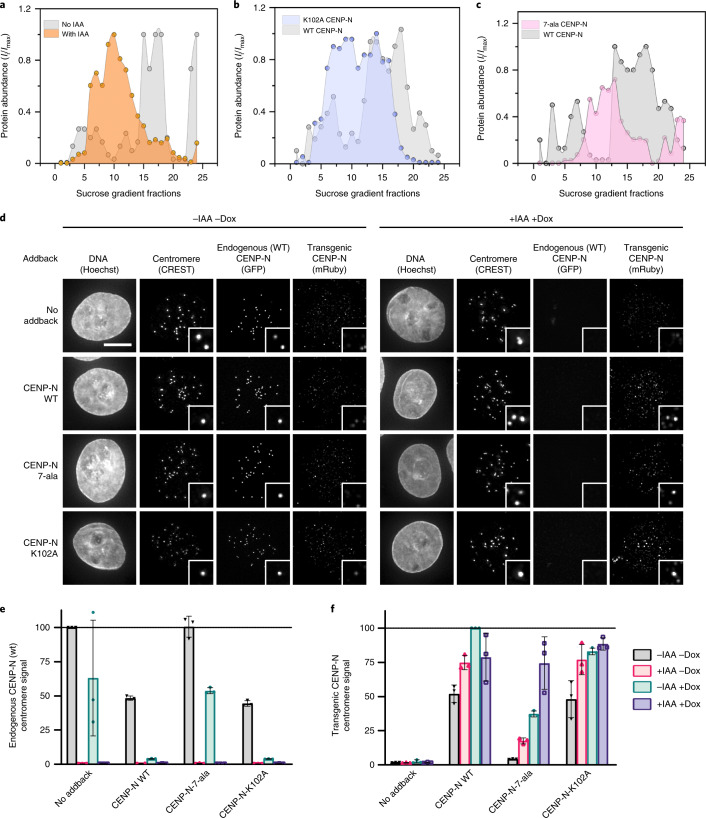
Fig. 4. CENP-N promotes the compaction of centromeric chromatin in vivo.
a, CENP-A distribution in sucrose gradient in the presence of WT CENP-N (gray) and after IAA-induced degradation of CENP-N (orange). An equal amount of chromatin was loaded per well on an SDS gel, resolved by blotting against H4 histone (Extended Data Fig. 9l). b,c, Comparison of CENP-A distribution in the presence of transiently expressed CENP-N variants, WT CENP-N (gray), K102A CENP-N (lilac), and 7-ala CENP-N (pink, 7 positively charged amino acids on α6 are mutated to alanine). Dots in a–c represent a mean of two biological replicates. Imax and Ii in a–c represent a maximum signal intensity from all fractions and the signal intensity in a given fraction, respectively. Solid lines represent interpolation between experimental data points (using Akima spline). d, Representative images of nuclei (Hoechst stain) showing endogenous WT CENP-N (GFP) or transgenic CENP-N variant (anti-Ruby antibody) localization at centromeres (CREST signal). Scale bar, 5 µm. Insets show magnified images of example centromeres (CREST foci). Cells were treated for 24 hours with doxycycline (dox) to induce expression of mRuby2-3×FLAG-tagged CENP-N (WT or mutant) and/or with indole acetic acid (IAA) to deplete endogenous auxin-inducible degron (AID)-tagged CENP-N-GFP as indicated. e,f, Normalized centromeric fluorescence signal corresponding to endogenous WT CENP-N (GFP) (e) or transgenic WT or CENP-N variant (anti-mRuby antibody) (f). Each dot represents the median centromeric CENP-N signal from >100 cells from 1 biological replicate. Line and error bars are mean of three biological replicates ± s.d.

